BRAVE Letter – Q2 2021
Dear Clients and Friends,
What a difference a year makes! We hope you and your family are happy and healthy as we continue to exit one of the most challenging periods of our lifetimes. In this letter we share an update on BRAVE, some thoughts on potential tax changes and what you may want to think about doing with your portfolios and other assets in light of those, a discussion on ROTH conversions, the continued current expensive state of U.S. equity markets, and how we are managing our client portfolios.
BRAVE Family Advisors Update
As the COVID fog continues to lift, operations at BRAVE have continued to return to a bit more normalcy. The Summit office reopened earlier this year and Suzie, Jamie, and Lisa are back in the office most days. We are in the process of doing and planning some client meeting travel this summer. This is the first long distance business travel for us in almost eighteen months.
We moved into a new office in Tiverton this month. We are at the same address but have moved into a larger and even more attractive space. The new office has sufficient room for additional employees and will allow us to have a conference room.
We are excited to have our first summer intern this year! Will Swart, who is a rising senior at Bryant University, is working in our Rhode Island office for ten weeks helping with a number of projects. Will is studying international finance and is Bryant’s starting goalie on their Division One soccer team. Welcome Will!
Update on Potential Tax Policy Changes
Despite tax policy changes being a significant feature of President Biden’s proposed economic policy during his campaign, the proposals that have been announced by his team in recent weeks seem to have surprised many people. Whether you support them or not, they will clearly result in a significant increase in income, capital gains, and estate taxes for the “investor class” if they are enacted.
To summarize the four major changes that have been proposed so far:
1.) Raising the top marginal ordinary income rate back to the Obama-era 39.6% from the current 37.0%.
2.) Increasing the tax rate on long-term capital gains and dividends to 39.6% from the current 20.0% for taxpayers with annual income in excess of $1 million. When the 3.8% Medicare surtax on high levels of unearned income is included the tax on capital gains for those taxpayers will be 43.4% versus the current 23.8%. State income taxes (where applicable) would be in addition to that.
3.) Cutting the lifetime Federal estate tax exemption to $5.0 million or $3.5 million per person (or $10.0 million or $7.0 million per couple). The current exemptions are $11.7 million per person and $23.4 million per couple. He also proposed increasing the estate tax rate to 45% from the current rate of 40%.
4.) Taxing unrealized gains at death. The current policy “steps-up” the cost basis on appreciated assets at death to the value at the time of death thus eliminating the potential capital gains tax for the heir(s). Under Biden’s proposal the unrealized gain would be taxed.
We do not know at this time whether any or all of these proposals or alternative policies will make their way through the narrowly divided houses of Congress and get signed into law. If changes are made that are retroactive to January 1, 2021, then there will be little that can be done to mitigate the potential impact of them. However, if the changes take effect prospectively, then we will communicate strategies to try to “get ahead” of their becoming effective.
These could include:
A.) Realizing long-term capital gains: Since your capital gains tax rate may nearly double if you make more than $1 million per year, locking in a gain at the current rate could represent a significant tax savings.
B.) Gifting assets: You can take advantage of the current $11.7/$23.4 million exemption to move as much as that amount of value out of your taxable estate to heirs or irrevocable trusts before the exemption is possibly cut in at least half.
C.) Making charitable contributions from your IRA: The IRS allows direct charitable contributions from IRAs of up to $100,000 per year. Using IRA funds to make charitable donations this year that you would otherwise make from other sources could provide a benefit if the top marginal ordinary tax rate is increased. The tax write-off at current tax rates could very well be less than the tax you will pay on the future IRA distributions that you and your heirs will be required to take at future higher tax rates.
D.) Converting 401(k) contributions to after-tax from pre-tax: Unlike with IRAs, there is no income limit on making ROTH contributions in a 401(k) plan. If the tax benefit of making a tax-deferred contribution is reduced, then high earners may get a greater benefit of making an after-tax contribution at current tax rates and having the money grow tax free for the rest of their lifetimes.
Please do not hesitate to contact us with any questions and look for further communications from us as tax policy changes become clearer.
Do ROTH Conversions Make Sense for You?
With the increased focus on the likelihood of higher income taxes over time and the elimination of the “stretch IRA” by the SECURE Act, we have been spending a lot of time in the last few months working with clients to help them understand whether converting traditional IRA and 401(k) assets to ROTH accounts makes sense. In some cases, the amount of tax savings over their and their children’s lifetimes can be shocking.
Tax-deferred retirement savings accounts are a very popular tool for Americans to save for retirement and defer income taxes on those savings. However, paying the tax is only delayed; it is not eliminated. The IRS requires that a minimum amount is withdrawn every year once an account holder reaches the age of 72. The annual percentage begins at about 3.9% the first year, but rises each year as remaining life expectancy declines. The required minimum distribution (RMD) reaches almost 6% at age 82 and 10% at age 92. Once the account owner dies and someone other than a spouse inherits it, then the government requires that the entire balance be withdrawn within 10 years and ordinary income taxes be paid on the entire balance.
In some situations, converting tax-deferred accounts into ROTHs during years in which the account owner’s marginal tax rate may be lower than it will be in later years can be a very effective tax planning and estate planning strategy. For example, we recently reviewed the situation for a couple who are both 60 years old, have household income of around $190,000, plan to retire at 62, have tax deferred retirement assets in excess of $2 million, and much smaller taxable investment account balances. If we assume that they only take the required minimum distributions from the retirement accounts and then leave the balance to their children when they pass 30 years after retirement, the potential Federal income tax that they and their family might owe on the retirement assets could be over $3.6 million dollars due to the potential growth in those assets. This couple has an opportunity to possibly manage their income over the next several years before they must take Social Security benefits and RMDs to allow them to convert proceeds from the tax-deferred savings into ROTH savings and pay the tax while they are in a lower marginal tax bracket than they and their children may be in the future. Based on one set of assumptions, the tax savings over the next 40 years for this family would be approximate $3.0 million!
Please let us know if you would like us to analyze your family’s situation to see whether ROTH conversions and/or making ROTH contributions to your 401(k) may make sense.
Market Thoughts
U.S. stock market remains at an interesting juncture. There are a number of positives: the major uncertainties of the last year, political- and COVID-related, have largely been eliminated; additional fiscal and monetary stimulus will likely be provided; and corporate earnings news should remain favorable. However, valuations by most measures remain stretched suggesting that much of the positive news may have already been discounted. We strongly expect that equities will continue to provide the best long-term returns, but would also suggest that the present is a good time to pare back risk profiles at the margin.
Despite earnings estimates having risen faster than stock prices in recent months, U.S. stock prices remain at historically expensive valuation levels and signs of speculation have become common place. By many long-term measures, the U.S. equity market is as highly valued as it was at the peak of the dot-com bubble in 2000 and the high in 1929; by some measures it has even exceeded those historical peaks. The primary valuation support remains stocks’ attractiveness relative to bonds, although that gap has begun to shrink. Developments such as the recent gyrations in “meme” stocks, the tidal wave of initial public offerings in SPACs (Special Purpose Acquisition Companies) earlier this year, and the unprecedented speculative activity in options suggest that animal spirits are once again reaching a frenzied level.
There are several measures that illustrate the current largely unprecedented valuation levels for U.S. stocks. The S&P 500 is currently trading at 21.5 times forward earnings which is well above average in absolute terms; this multiple has declined slightly in recent months from a high in excess of 22.0 times as the economic recovery has been stronger than expected. The U.S. total market capitalization as a % of GDP is at a new modern high (Chart 1). The current CAPE ratio (Cyclically Adjusted Price to Earnings ratio) of 37 indicates that stocks are at among their most expensive levels in the last 100 years only exceeded just before and just after the 2000 peak (Chart 2). U.S. stocks also remain expensive relative to those in other regions trading more than four standard deviations above their 50-year valuation mean relative to European stocks (Chart 3). Within the U.S. market, growth stocks have seen some underperformance relative to value stocks in recent months but remain at levels above those seen at the peak of the dot com bubble twenty years ago (Chart 4).
Chart 1: Wilshire 5000 Total Market Capitalization to US Annual GDP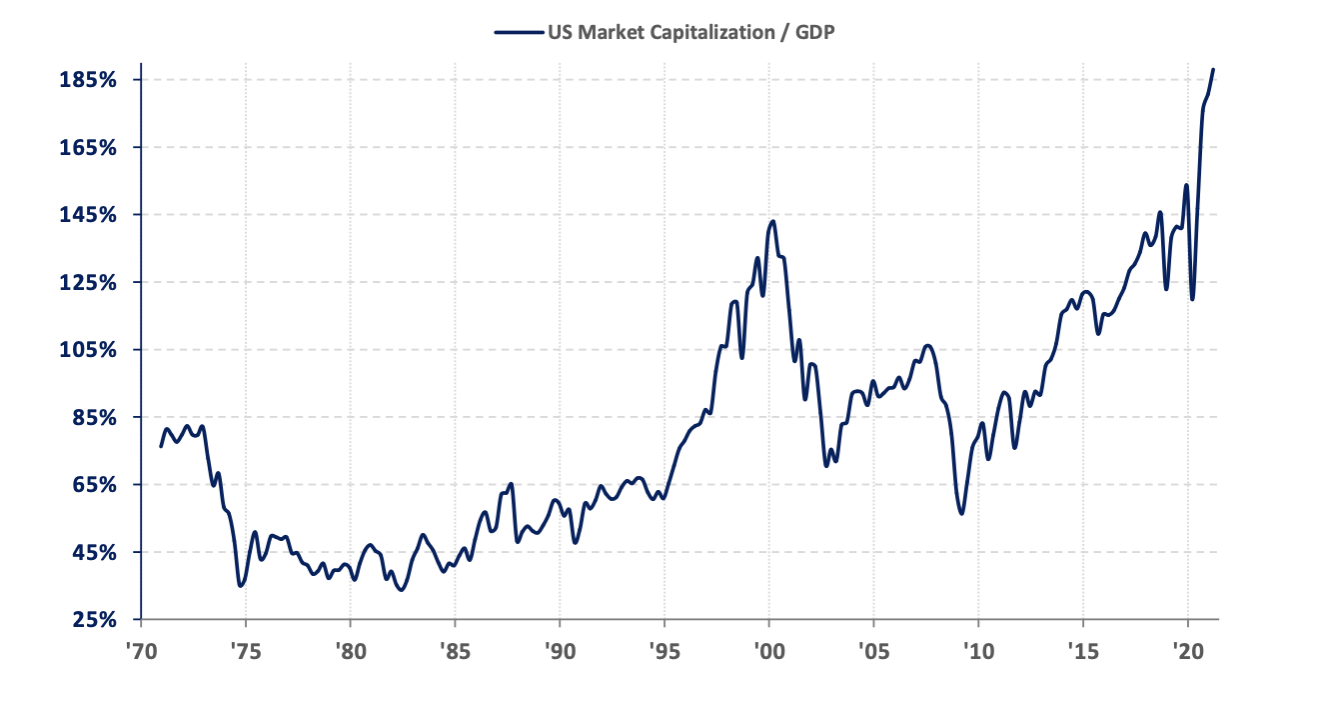
Chart 2: Long-term Historical Cyclically Adjusted PE Ratio with Recessions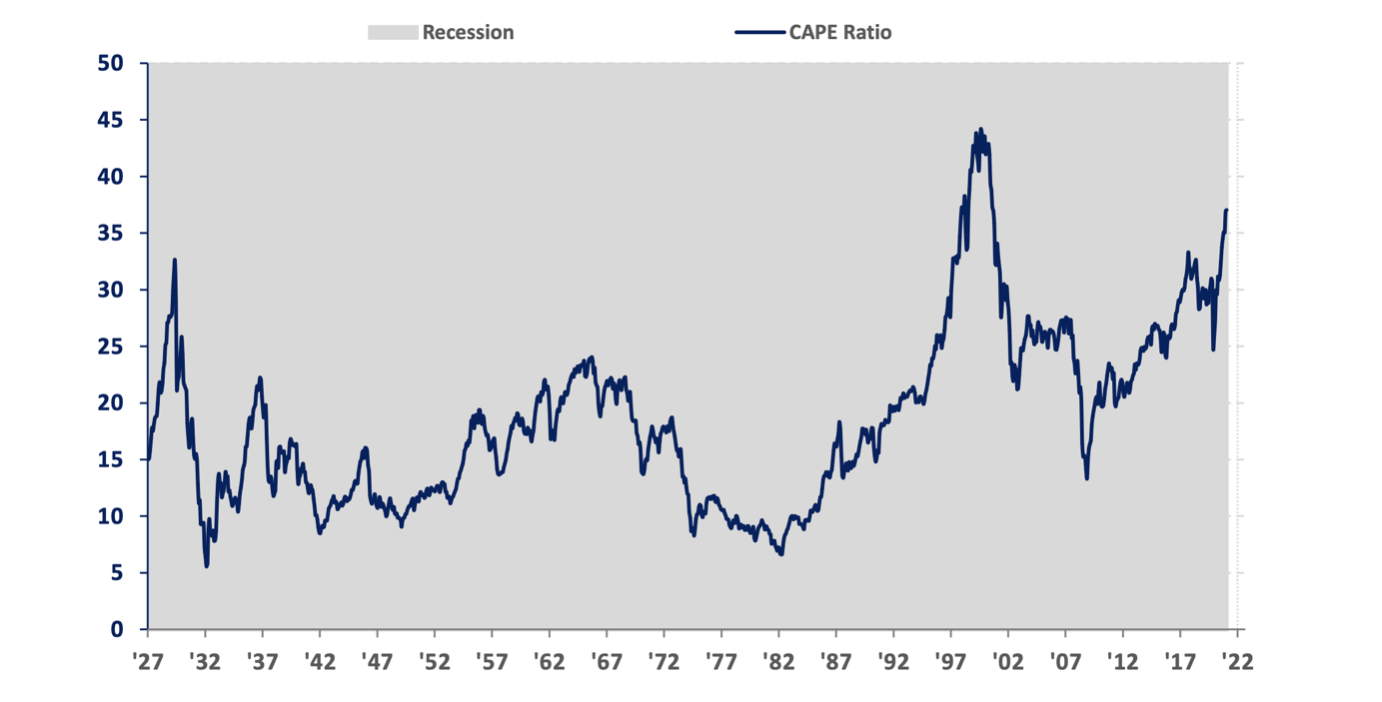
Chart 3: MSCI United States Index vs. MSCI Europe Index
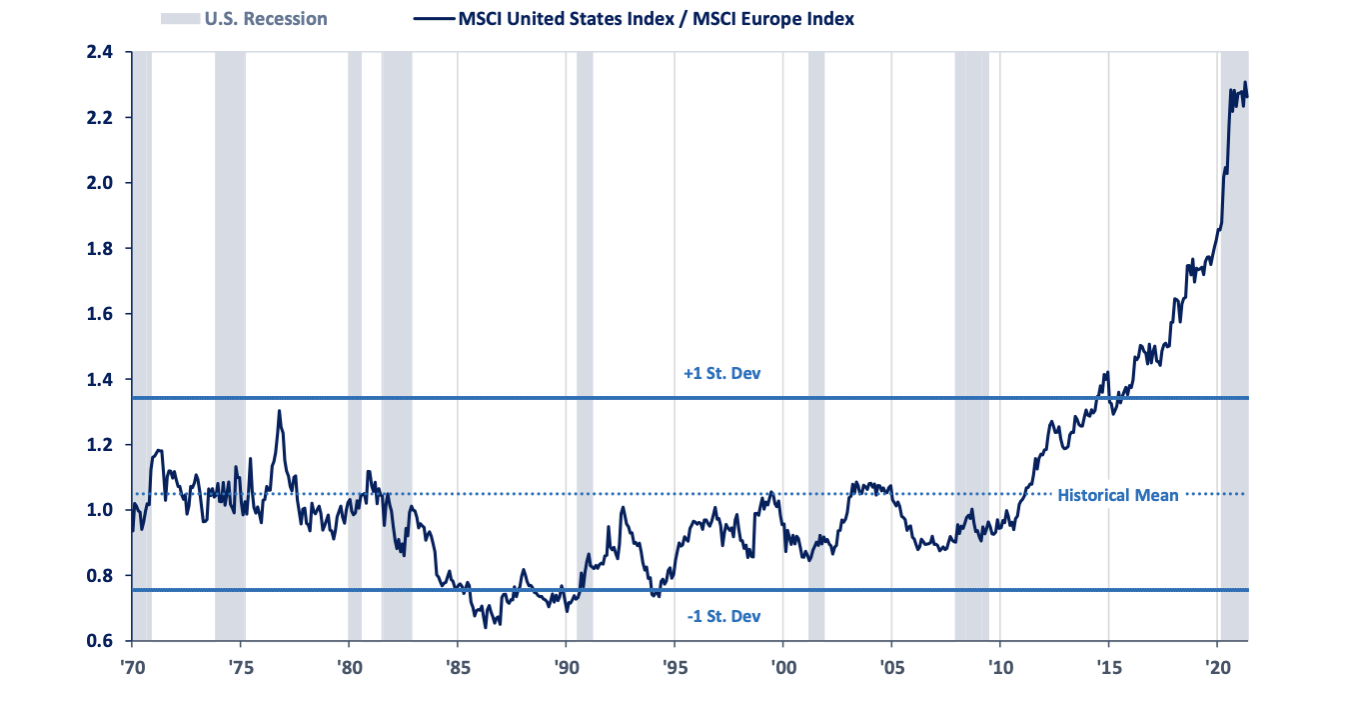
Chart 4: Russell 2000 Growth Index vs. Russell 2000 Value Index 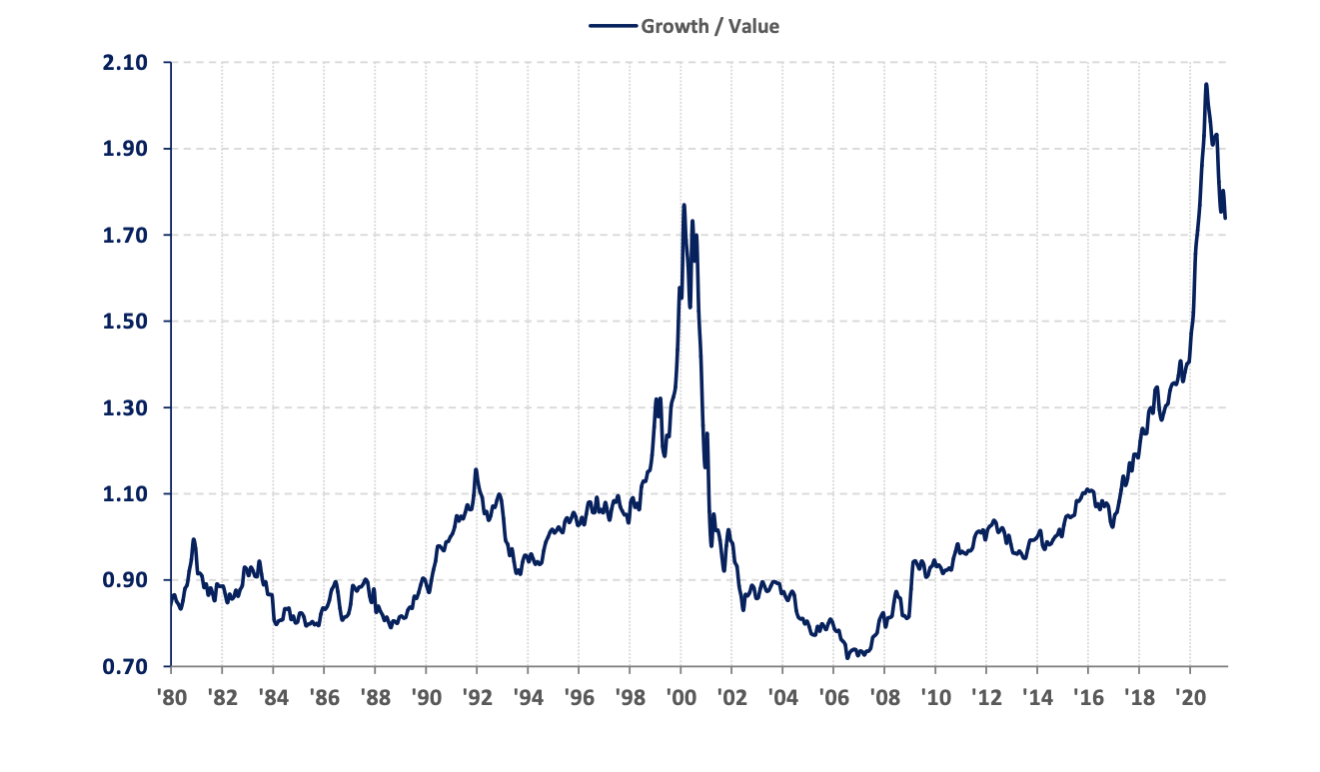
The biggest valuation support for the current U.S. stock market continues to be “TINA” (There Is No Alternative). The dividend yield of 1.35% for the S&P 500 is still attractive relative to interest rate levels available in the U.S. fixed income market and even more so relative to the trillions of dollars of negative yielding debt around the world (Chart 5). The impact of extreme liquidity and low available interest rates can be seen in record M&A activity and margin debt, a recovery in share buyback activity, and very high levels of retail equity purchases. We expect this support to diminish over time as rates maintain their gradual move higher due to the likely potent combination of further massive fiscal and monetary stimulus, the additional reopening of the economy as vaccinations and herd immunity reduce the virus’ impact, and the growing signs of a pick-up in inflation. For the time being, though, liquidity may very well continue to overwhelm valuation.
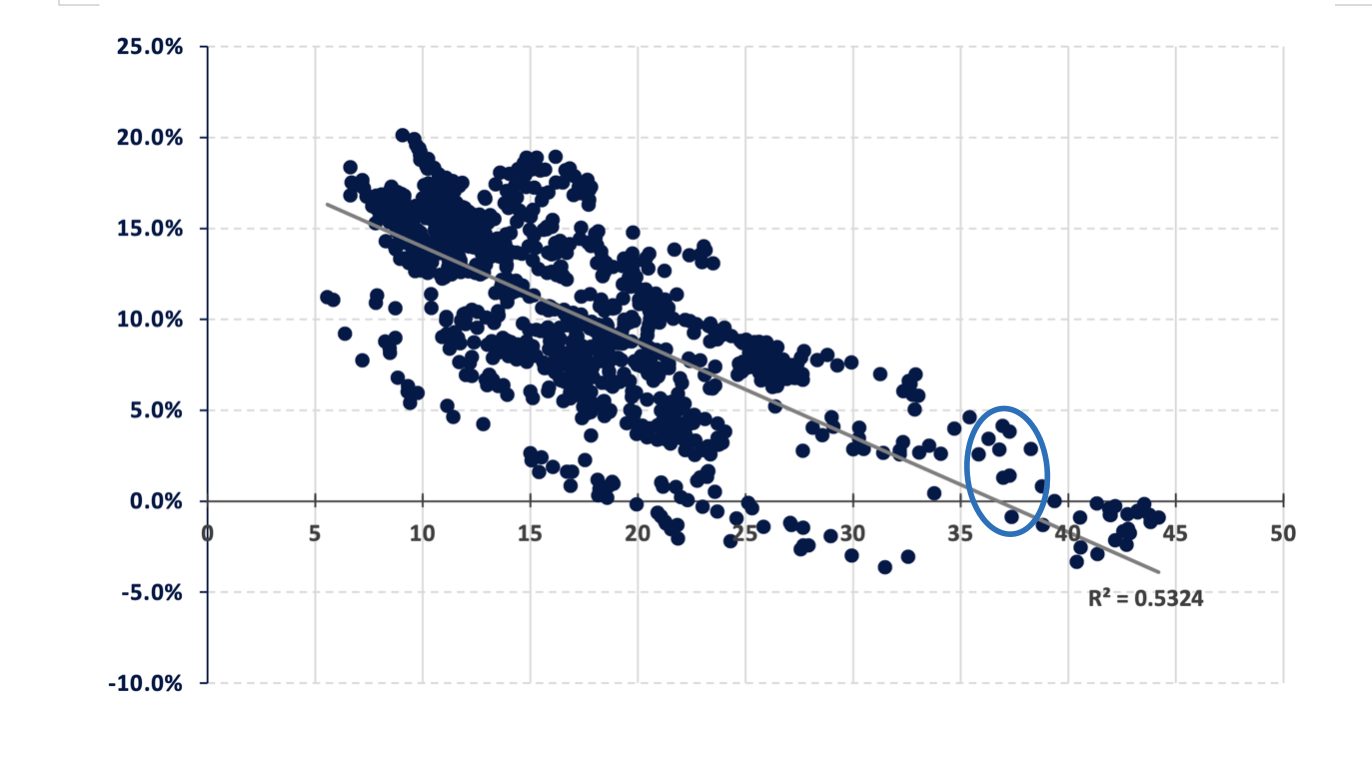
We remain of the belief that the high valuation of U.S. stocks doesn’t necessarily mean that disaster lies ahead; however, it does suggest that future equity returns are likely to be well below historical averages. There is a strong correlation between current valuation levels and future returns. Typically, the cheaper stocks are, the higher future returns will be and vice versa. This relationship can be seen in Chart 6 which illustrates the relationship between the beginning CAPE ratio and stock market returns over the next 10 years. A beginning CAPE ratio of around the current level of 37 has yielded 10-year future annual average returns in a range of -1% to +4% over the last 94 years. Due to the limited experience with valuations at this level there is not a lot of historical data; however, what is available suggests that investors may need to adjust their expectations to something less than the historical average equity return of close to 10% per year.
Chart 5: S&P 500 Dividend Yield and 10 Year Treasury Yield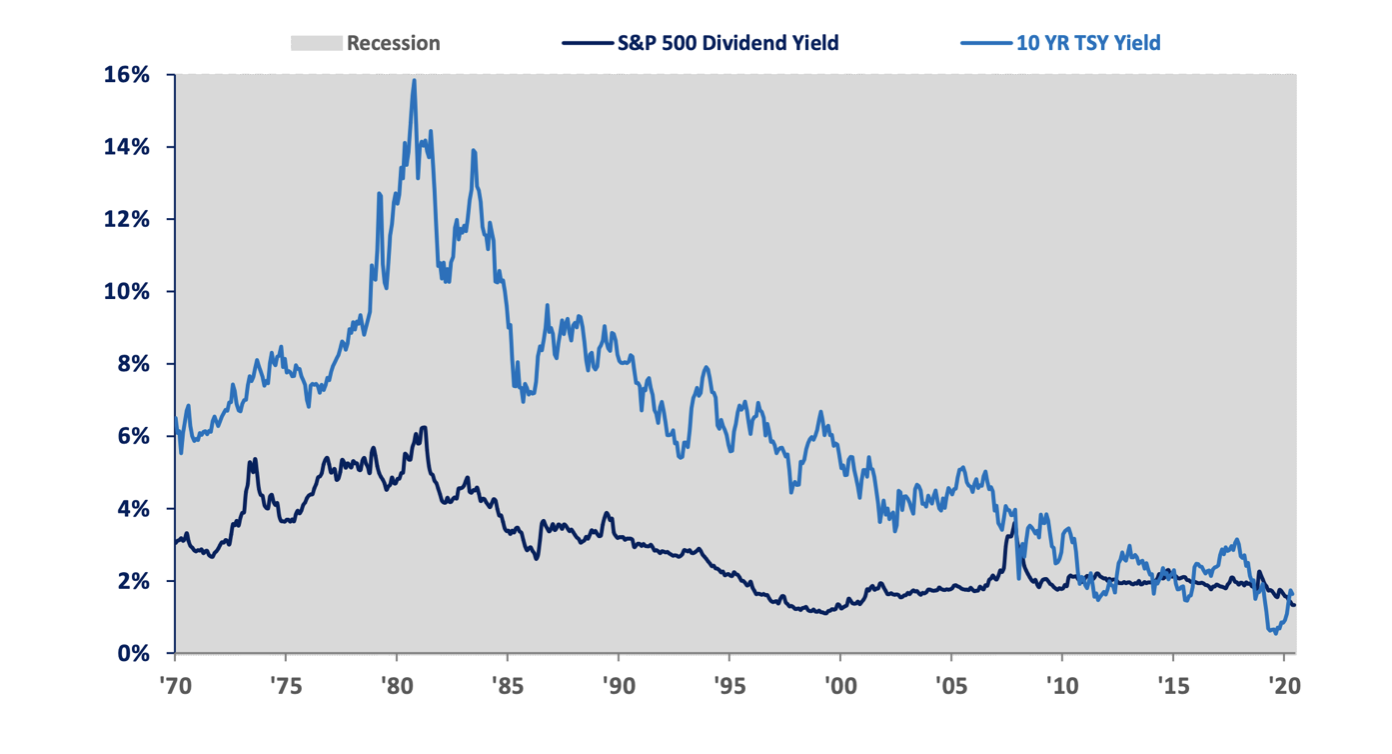
Chart 6: Next 10 Year Annualized Returns of S&P 500 Index (Vertical Axis) vs. Beginning CAPE Ratio (Horizontal Axis)
Portfolio Management
We have not made any major changes in client portfolios in recent months. We continue to be a bit overweight value and international stocks due to their more attractive valuations compared to growth and U.S. stocks, respectively. After exiting a large gold position last fall, we have added some exposure to metal again as we believe that it provides diversification from expensive U.S. stocks and should benefit over time from the low real interest rates and growing government debt levels.
In our fixed income portfolios, we have maintained relatively short duration since early spring of last year as we believe a potential generational low in interest rates has been seen. We have been including the iShares Preferred and Income Securities ETF (Ticker: PFF) and a Nuveen national municipal bond closed-end fund (Ticker: NEA) in many portfolios to increase yields on a tax-advantaged basis. The former fund holds preferred securities that have characteristics of both stocks and bonds. Importantly, the fund pays an approximate 5% yield that is primarily taxed as a dividend rather than as corporate interest. The latter fund holds municipal bonds and uses some leverage to increase the yield. It currently pays interest at an approximate 4.5% rate and is Federal tax free and trades at a 3% discount to its net asset value.
Administrative Items
As always, we welcome your comments and questions. Please don’t hesitate to call, visit, or email at any time.