BRAVE Letter – Q1 2023
Dear Clients and Friends,
Happy 2023!
Looking out over the next twelve months we are not bullish overall on market prospects, but, rather than a year ago when virtually all markets were overvalued, we believe that there are pockets of opportunities in both the stock and bond markets. In this letter we share an update on BRAVE, some recent changes that affect retirement savings and gifting, our current nuanced view on the markets, how we are implementing that view in managing our client portfolios, and a few administrative items.
BRAVE Family Advisors Update
BRAVE had a strong year of growth in 2022. We increased our employee count by one-third with the addition of Angie and Will to the team. We moved into larger and more modern office space in Summit (albeit across the hall from our former office!). Despite the market declines we experienced one of our best years for new business in the firm’s thirty-year history.
Later this month our team will be holding a day-long offsite meeting. We’ll be reviewing the year that was, setting goals for the future, and working with an expert on client experience in an effort to continue to improve ours.
A big “THANK YOU” to those of you who referred family members and friends to BRAVE last year. Our increased capacity allows us to continue working with additional individuals and families who can benefit from our services.
Increased IRS Limits
One of the few positives of the current high inflation rate is that the Internal Revenue Service again increased the 2023 limits on gifting and the annual contribution limits on certain types of retirement savings plans.
|
2022 |
2023 |
|
| Annual per person gifting limit | $16,000 | $17,00 |
| Lifetime gifting limit | $12.06 million | $12.92 million |
| 401(k) plan contribution limit | $20,500 | $22,500 |
| Catch-up 401(k) contribution limit over 50 years of age | $27,000 | $30,000 |
| Catch-up 401(k) contribution limit over 50 years of age | $6,000 | $6,500 |
| Catch-up IRA contribution limit over 50 years of age | $7,000 | $7,500 |
SECURE ACT 2.0
A number of enhancements to retirement savings were signed into law just before the end of last year. The package, titled SECURE Act 2.0, included numerous changes with the most significant to our clients likely being:
- Raising the age at which RMDs from retirement accounts begin to 73 in 2023 and 75 in 2033.
- Catch-up contributions to 401k plans will be increased beginning in 2025 for workers turning 60, 61, 62, or 63.
- Catch-up contributions for workers earning in excess of $145,000 will need to be ROTH contributions which may have adverse tax consequences.
- Up to $35,000 can be rolled over from a 529 plan that has been open for at least 15 years into a ROTH IRA account for the 529 plan beneficiary.
Market Thoughts: Cheaper But Not Cheap
Our current outlook for markets is significantly more nuanced than it was this time last year as the recent declines have begun creating pockets of opportunity. In our 2022 Outlook letter we described our approach to markets at that time as KISS, which is an acronym for Keep It Simple, Stupid. We believed that markets were historically expensive and the primary factor that justified those valuations, massive government stimulus, was in the process of being taken away and that would result in increased volatility and lower returns. That obviously was exactly what played out in most financial markets.
This year is not so simple. Equity markets have gotten cheaper but are not cheap at a time when most companies are likely facing increased headwinds in the areas of slowing demand and higher capital costs. Growth stocks and international stocks have begun to unwind their historical overvaluation relative to value and U.S. shares, respectively, but likely have further to go. The Federal Reserve appears unwilling to heed increasingly clear signs of economic weakening which may mean that the yield curve will invert further creating divergent performance within different parts of fixed income.
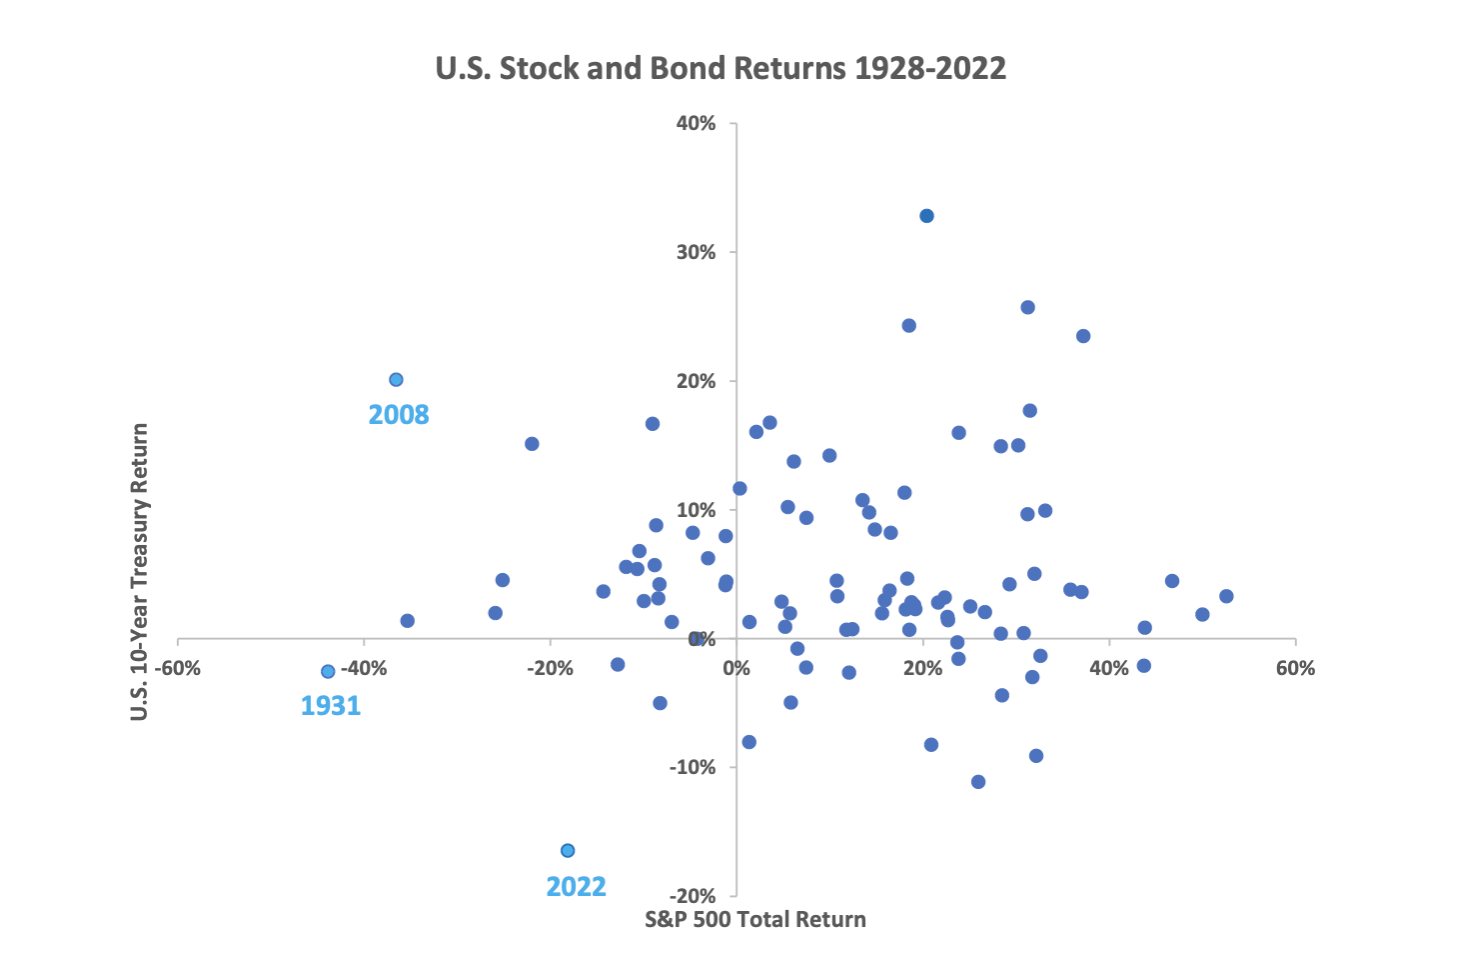
Last year U.S. markets arguably had their worst performance in at least 100 years. The combined returns of the stock market and the bond market were the lowest since 1931 (Chart 1). This chart is a scatterplot of the annual returns of the S&P 500 (horizontal axis) and the 10-year U.S. Treasury note (vertical axis). However, what set 2022 apart was that there was virtually nowhere to hide. In two of the worst years in modern stock market history, 1931 and 2008, bonds suffered only a small decline or were a positive offset. Last year, bonds performed nearly as poorly as stocks. This was because both markets had been driven to overvaluation by low inflation and extreme levels of government stimulus. When those influences reversed, both markets felt the pain.
Chart 1: Scatterplot of Annual U.S. Stock and Bond Returns
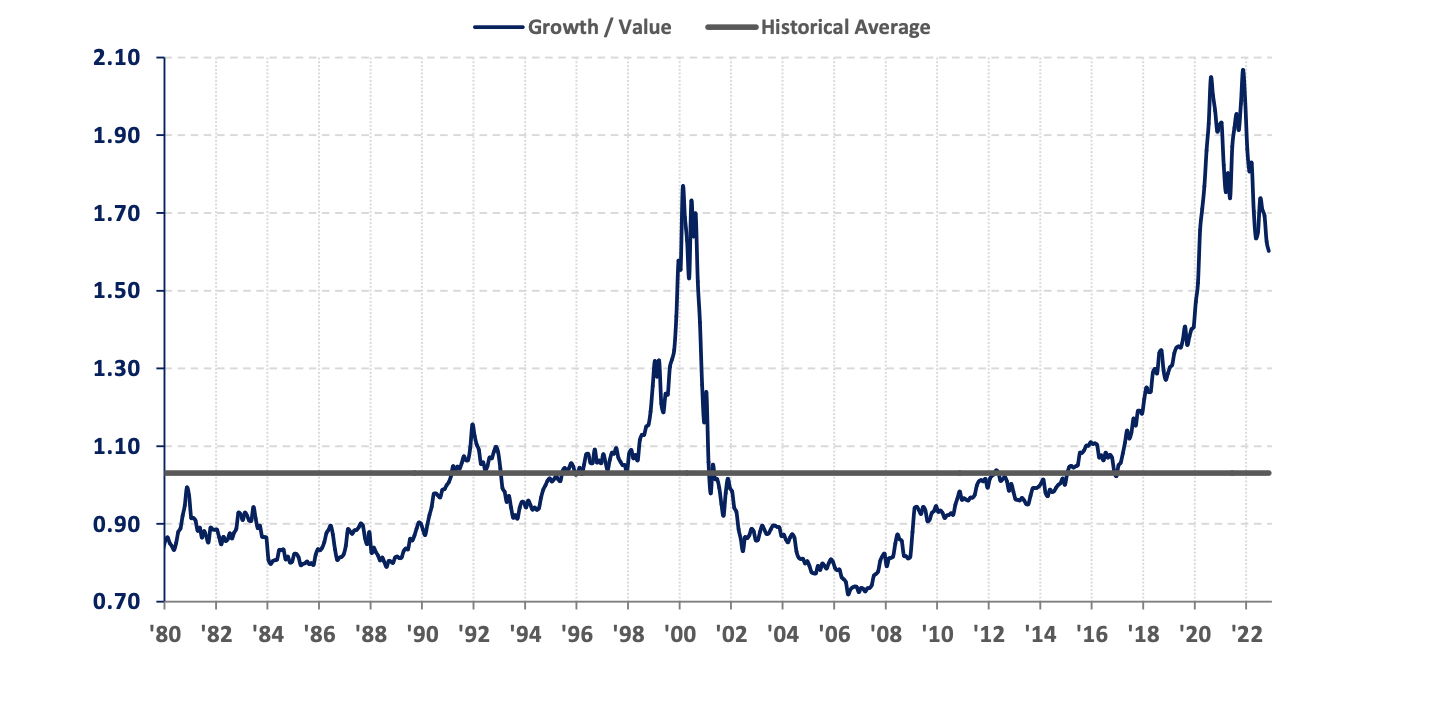
U.S. stocks are significantly less overvalued than they were a year ago, but are still a long way from being cheap. In most cases the market only looks attractively valued relative to other peak periods such as a year ago or the peak of the Dotcom bubble in 2000 or 1929. The S&P 500 is currently trading at 17.0 times forward earnings which is marginally above average; this multiple has declined in recent months from a high in excess of 22.0 times during late 2021. The risks in declaring equities fairly valued on this basis are 1.) earnings estimates for 2023 have only recently begun to be revised lower and may have significantly further to go and 2.) the interest rate environment has become much less supportive than it had been in recent years. The U.S. total market capitalization as a % of GDP has declined by over 25%, but is still above the level reached at the peak in 2000 (Chart 2). The current CAPE ratio (Cyclically Adjusted Price to Earnings ratio) of 27 is down by almost one-third from the recent peak, but is still higher than almost all modern periods other than just before and just after the 2000 peak and 1929 (Chart 3). U.S. stocks also remain very expensive relative to those in other regions of the world still trading about three standard deviations above their 50-year valuation mean relative to European stocks (Chart 4). Within the U.S. market, growth stocks have finally begun unwinding their extreme overvaluation relative to value stocks, but are only slightly below their previous peak and are significantly above the long-term average (Chart 5).
Chart 2: Wilshire 5000 Total Market Capitalization to US Annual GDP
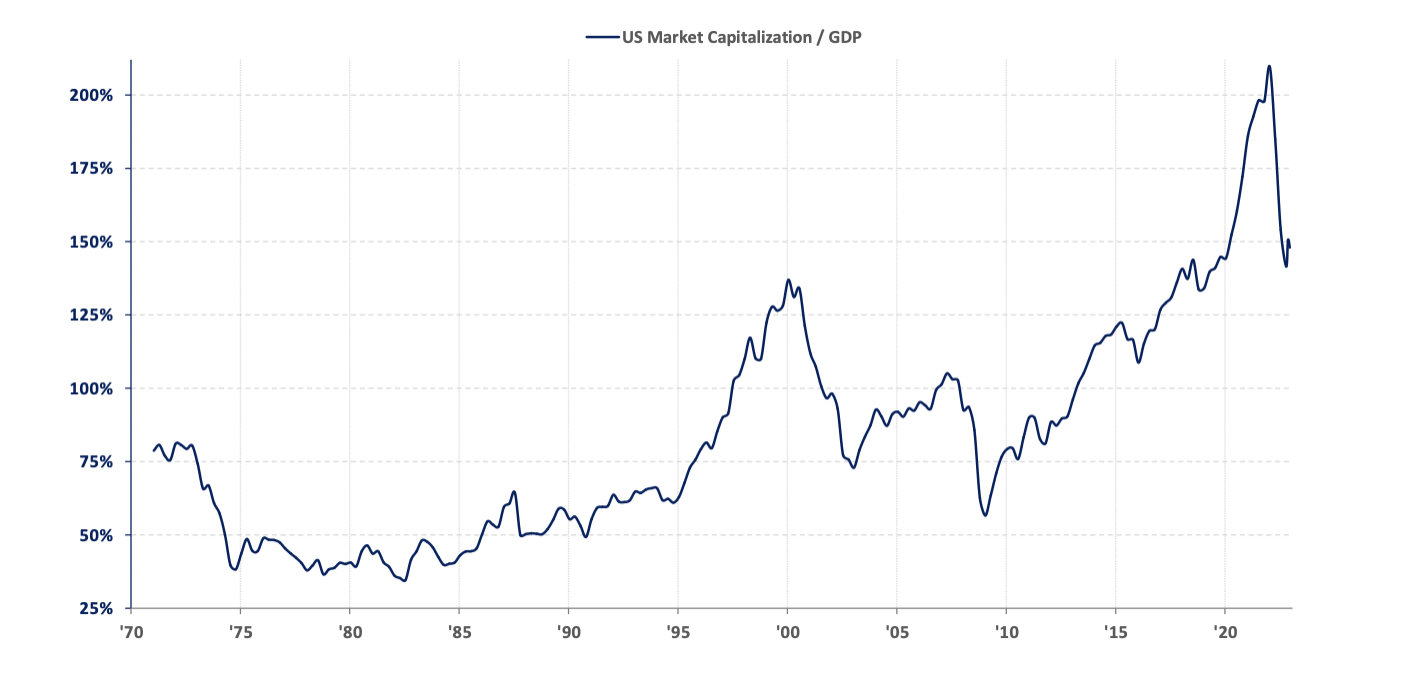
Chart 3: Long-term Historical Cyclically Adjusted PE Ratio with Recessions
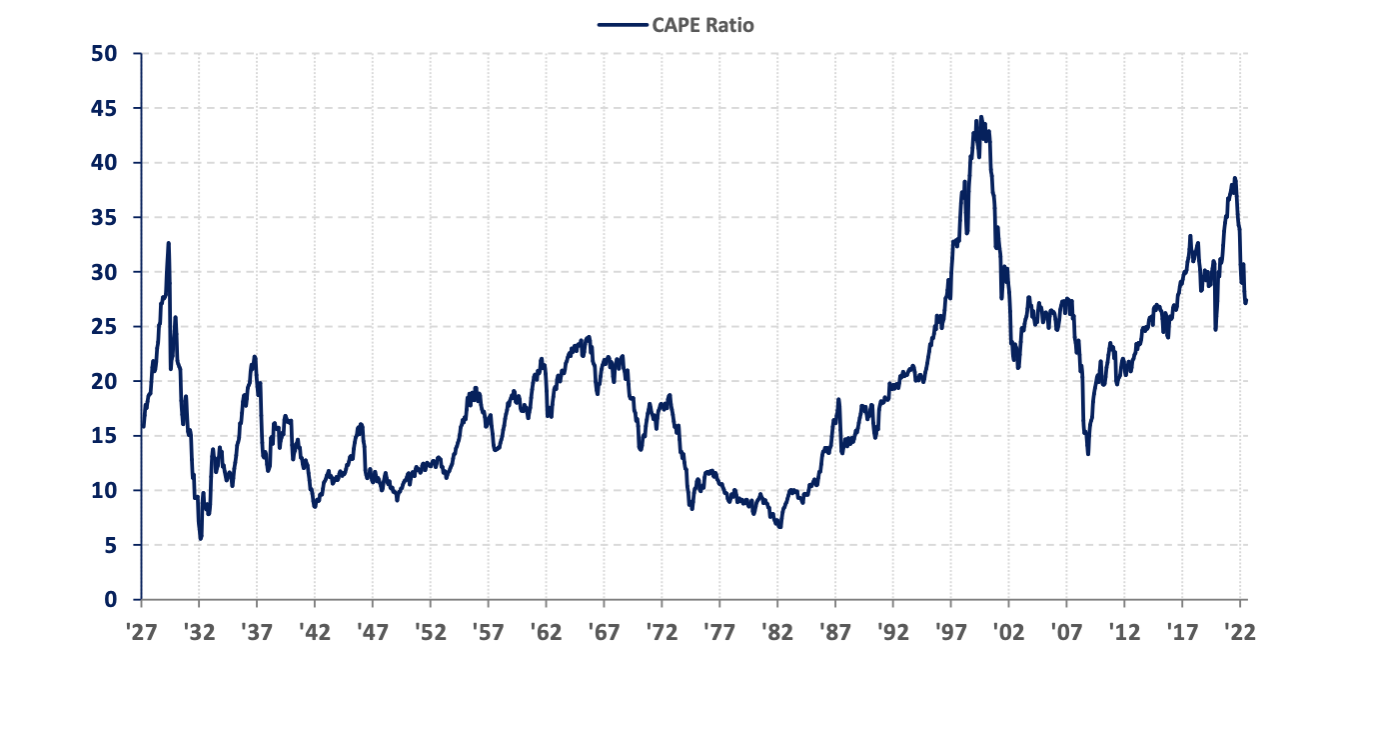
Chart 4: MSCI United States Index vs. MSCI Europe Index
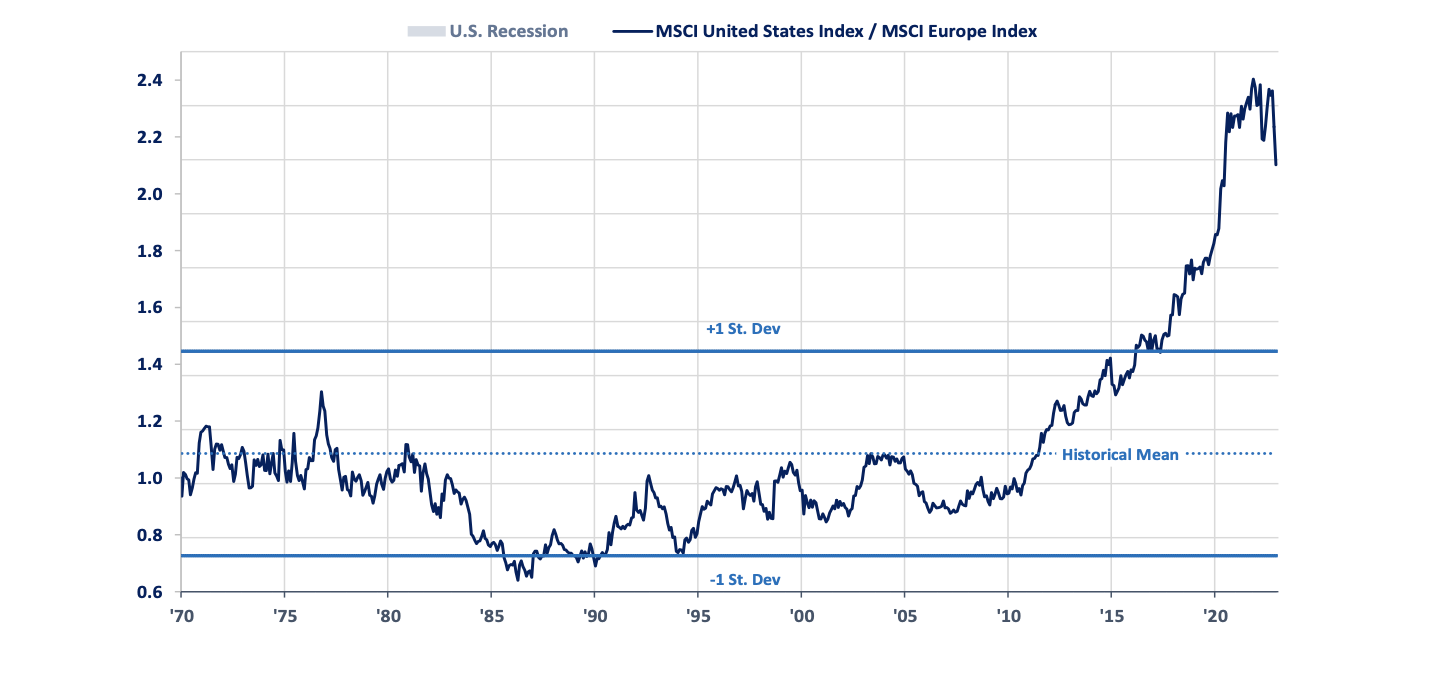
Chart 5: Russell 1000 Growth Index vs. Russell 1000 Value Index
Bonds on the other hand appear to offer value relative to stocks after their significant declines last year. The yield on the 10-year Treasury note is at the widest premium to the yield on the S&P 500 index in fifteen years (Chart 6). This is happening at a time when the likelihood of a recession seems to be very high based on historically reliable indicators such as the inversion of the yield curve and the downturn in the Index of Leading Indicators (Charts 7 and 8). An economic slowdown should be positive for bonds as inflation would likely slow more quickly while being negative for stocks as corporate earnings would come under more intense pressure.