Dear Clients and Friends,
Eight months into the year, the performances of both the U.S. stock and bond markets almost exactly match their average annual performance of the last 100 years. The S&P 500 Index is up a little more than 10%, while bonds are up about 5%. The recovery in stocks from the April tariff-driven sell-off has taken them to new price highs and new valuation extremes; there is no obvious reason to expect that to change.
In this letter we share an update on BRAVE, the most relevant aspects of the “One Big Beautiful Bill Act”, a description of some of the ways we work with clients to attempt to reduce their estate taxes, our current view on the markets, how we are implementing that view in managing our client portfolios, and a few important administrative items.
BRAVE Family Advisors Update
BRAVE has continued to experience solid growth this year through both new clients joining the firm and existing clients growing their relationship with us. Over the last ten years the size of the firm in terms of the number of clients we serve has more than tripled. While we remain selective, we are still welcoming new clients so if you have friends or family members who might benefit from speaking with us, please let us know.
Over the last year we have enhanced the way we manage our client accounts. We have always discussed the markets and our holdings internally, but that tended to be relatively casual. We decided last year to implement an Investment Committee that is composed of Brett, Scott, Jamie, Yiorgos, and Will. The committee meets once or twice a month to review the firm’s holdings in the context of market developments and to make recommendations for any changes. As Chief Investment Officer, Scott continues to have ultimate authority on implementing any of the recommendations. This evolution has helped us create a more “institutionalized” portfolio management process while also giving experience and more voice to Yiorgos and Will.
We were fortunate to have Todd DiLullo working with us for the summer in our Rhode Island office. He will be starting his senior year at Bryant University, Will’s alma mater, majoring in Finance with a minor in Applied Statistics. Todd commutes to school from Warwick, RI, where he lives with his parents. Outside of academics and his part-time work as a valet, he enjoys golfing, spending time outdoors, and exploring new foods. We are grateful for his contributions this summer and wish him the best in his final year of college.
Todd and Will enjoying the sights of NYC after a day in our Summit, NJ, office:

The “One Big Beautiful Bill Act”
The bill was signed into law on July 4th of this year and made permanent several provisions of the 2017 Tax Cuts and Jobs Act (TCJA) that would have ended on December 31 of this year and introduced a number of other far-reaching changes to tax policy.
Of the numerous things included in the new law, we believe that these are the most relevant to BRAVE’s clients:
Income tax rates: The tax rates that were set under TCJA are now permanent, meaning that the top rate will remain 37%. This rate kicks in at $626,350 for individual filers and $751,600 for joint filers in 2025. Those income levels are indexed to inflation in future years.
Estate taxes: The Federal lifetime gift/estate exemption is set at $15 million per person beginning this year and is indexed to inflation in future years. This means that a couple should enjoy a $30 million total exemption in 2025 dollars.
SALT deduction: The Federal tax deduction for state and local taxes increases to $40,000 from $10,000 through 2029 with a 1% annual increase in 2026-29. However, the higher limit phases out beginning at an income level of $500,000 for joint filers and returns to $10,000 at $600,000.
Charitable deductions: Only deductions in excess of 0.5% of Adjusted Gross Income will be deductible beginning in 2026. Also, for taxpayers in the top bracket of 37% the deductibility will be limited to 35%. This means that for someone in the top bracket making $1 million per year a $10,000 charitable contribution in 2025 would be worth a tax savings of $3,700, but in 2026 it would be worth only $1,750. This change potentially warrants front loading charitable contributions before the end of this year. The use of a donor advised fund can help facilitate this. Please let us know if you would like to discuss this option.
529 account uses: The scope of education expenses that can be funded by 529 accounts was further expanded. The new law increases the use of the accounts for K-12 costs to an annual limit of $20,000 versus the current $10,000 and allows some costs other than tuition (testing fees, homeschool expenses, coaching, academic tutoring, ADHD support, etc.) to be covered.
Working with Clients to Minimize Estate Taxes
At BRAVE, we only charge fees on managing our clients’ portfolios, but for many clients we do a lot more than that. An area in which we can potentially help is managing estate taxes. The Federal estate tax exemption is now $15 million and is indexed to inflation. A couple should be able to shield $30 million. For clients who have an estate tax liability above that level, we can work with them and their trust & estate lawyer on developing and executing strategies to reduce that burden. Those strategies can include:
- Family loans/GRATs: Lending money or securities to loved ones at a favorable interest rate can reduce additional appreciation of one’s estate.
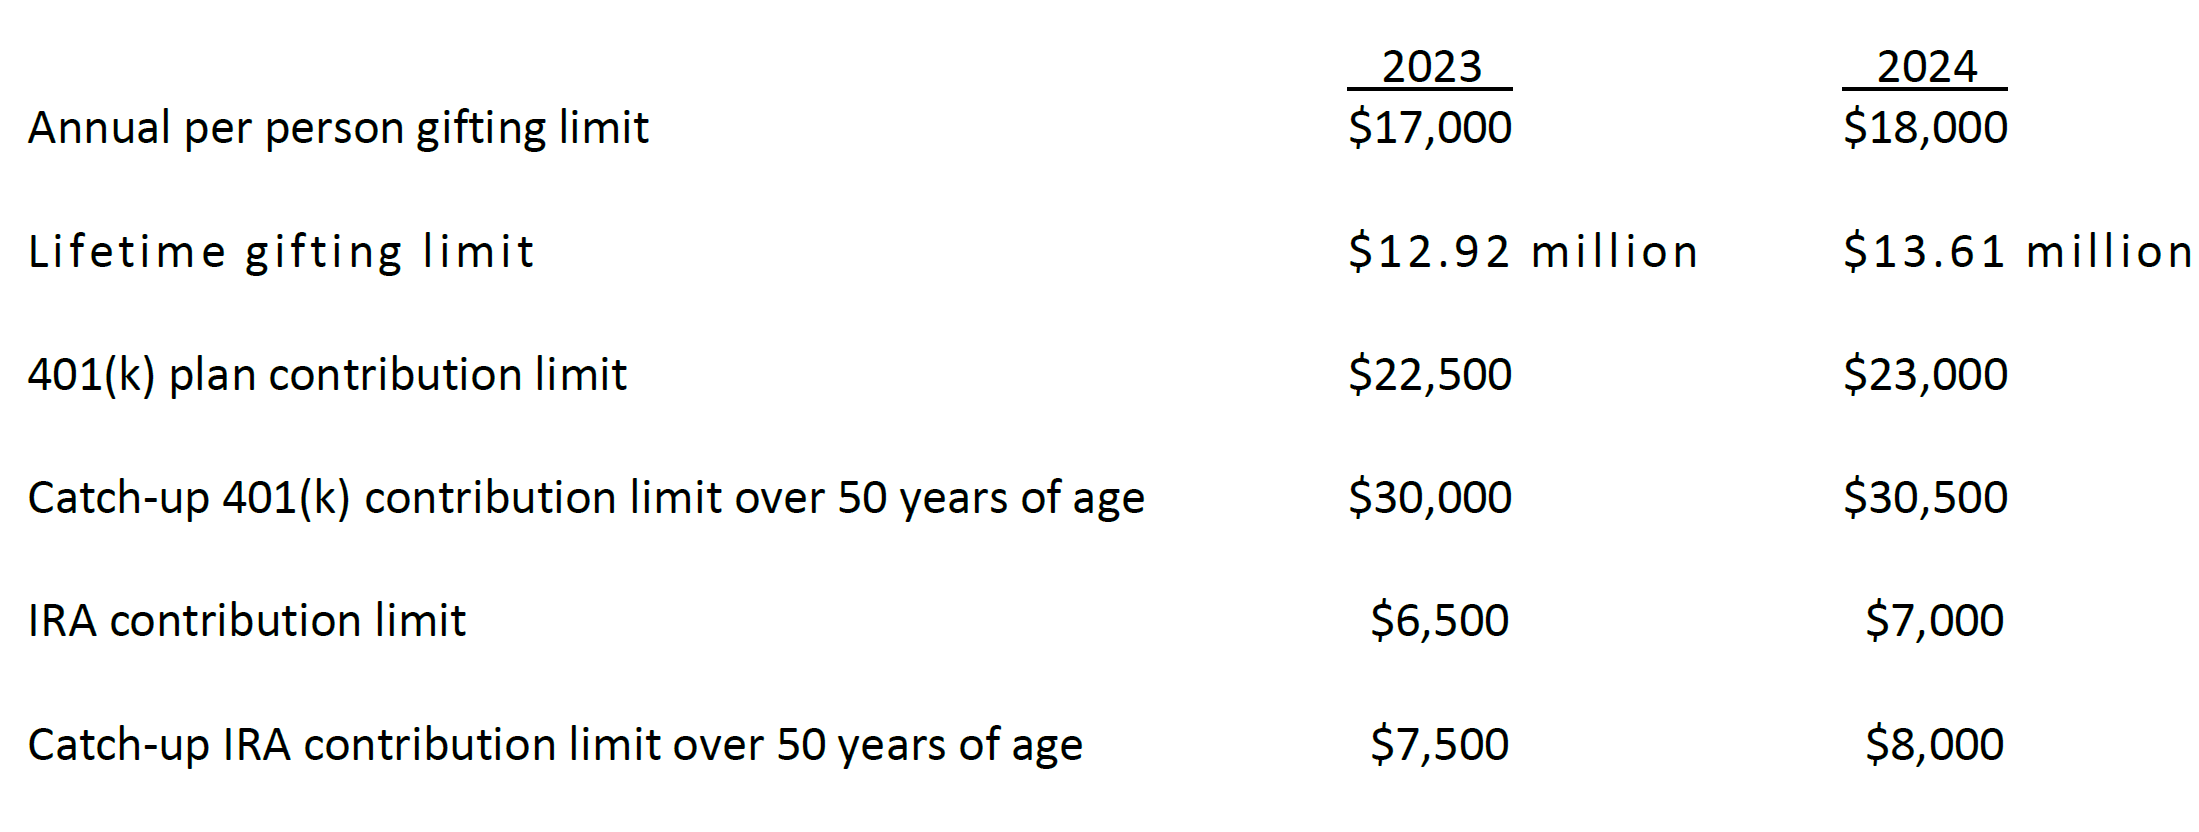
- Gifting strategies: Making annual or lifetime gifts can reduce the size of a taxable estate.
- Trust planning: Establishing and funding irrevocable trusts can reduce the estate size and provide control and protection over assets.
- Charitable planning: Donating assets to a donor-advised fund, a foundation, or a charitable trust can provide income tax benefits in addition to reducing estate taxes while supporting meaningful causes.
- Life insurance planning: Using life insurance to help cover potential estate tax liabilities and provide liquidity to heirs without forcing the sale of other assets.
For those of our clients who live in one of the eighteen states that impose an estate or inheritance tax, there may be additional opportunities for us to help reduce or eliminate the state-level burden. One of the most basic mechanisms is for both spouses to establish revocable trusts and to fund those trusts with sufficient assets for both trusts to take advantage of the state estate tax exemption which potentially doubles the amount of assets not subject to the state estate tax.
Recently we have been working with a family that will have a Rhode Island estate tax liability when the father dies. He is a widower in his late-80s and has one child, a daughter in her early-60s. His estate is currently valued at approximately $3.5 million. RI imposes a tax on estates valued at more than $1.8 million (indexed for inflation) with a progressive tax rate that starts at 7.2% and peaks at 16.0%. If the father passes away under current circumstances, his estate will owe approximately $150,000 to the state of RI rather than that $150,000 going to his daughter. Unlike the Federal government, RI does not consider lifetime gifts in its estate value calculations. We are working with the father and his trust & estate lawyer to facilitate a gift of $1.7 million to his daughter to get his estate value down to the RI exemption and avoid the estate tax. He and his daughter have a close relationship, so he is confident that she would gift money back to him if he needed it for long-term care.
Helping clients deal with issues like this is very fulfilling. Managing portfolios is obviously very important, but that has become “table stakes” in our business…meaning doing a good job should be a given. Where we can sometimes really “move the needle” for our clients and their families is in areas like just described which can have a bigger impact on their finances than outperforming the market. We are usually in a unique position to provide insight like this because a client often isn’t aware of the intricacies of things like state estate taxes; their tax person is focused on their income tax and usually has limited knowledge of the value of their assets; and their trust & estate lawyer typically is not in regular contact with them so is not thinking about their situation on an on-going basis. We are usually the only ones who have both the specialized knowledge of things like estate taxes, life insurance, reverse mortgages, estate planning, etc. and intimate familiarity of a client’s financial world to be able to provide this kind of insight.
Please do not hesitate to contact us if you want advice on any issues in your family’s financial world.
Market Thoughts: Expensive Market, But Why Will That Change?
Writing these letters is easy when we feel like we have something insightful to say about the markets that we are excited to share with our clients and friends. Finding that inspiration the last couple of years has not been easy. The story of the U.S. stock market has pretty much remained the same…it is very expensive but there is nothing we can point to that suggests that will change.
This year has only reinforced that view as the stock market corrected sharply in April on the back of President Trump’s initial tariff policy announcement only to quickly rebound to new all-time highs two months later. Having weathered the economic policy turmoil of the last few months, there is no obvious reason to argue that stocks will decline as tax policy is now certain, corporate earnings are holding up better than expected, and short-term interest rates look likely to decline.
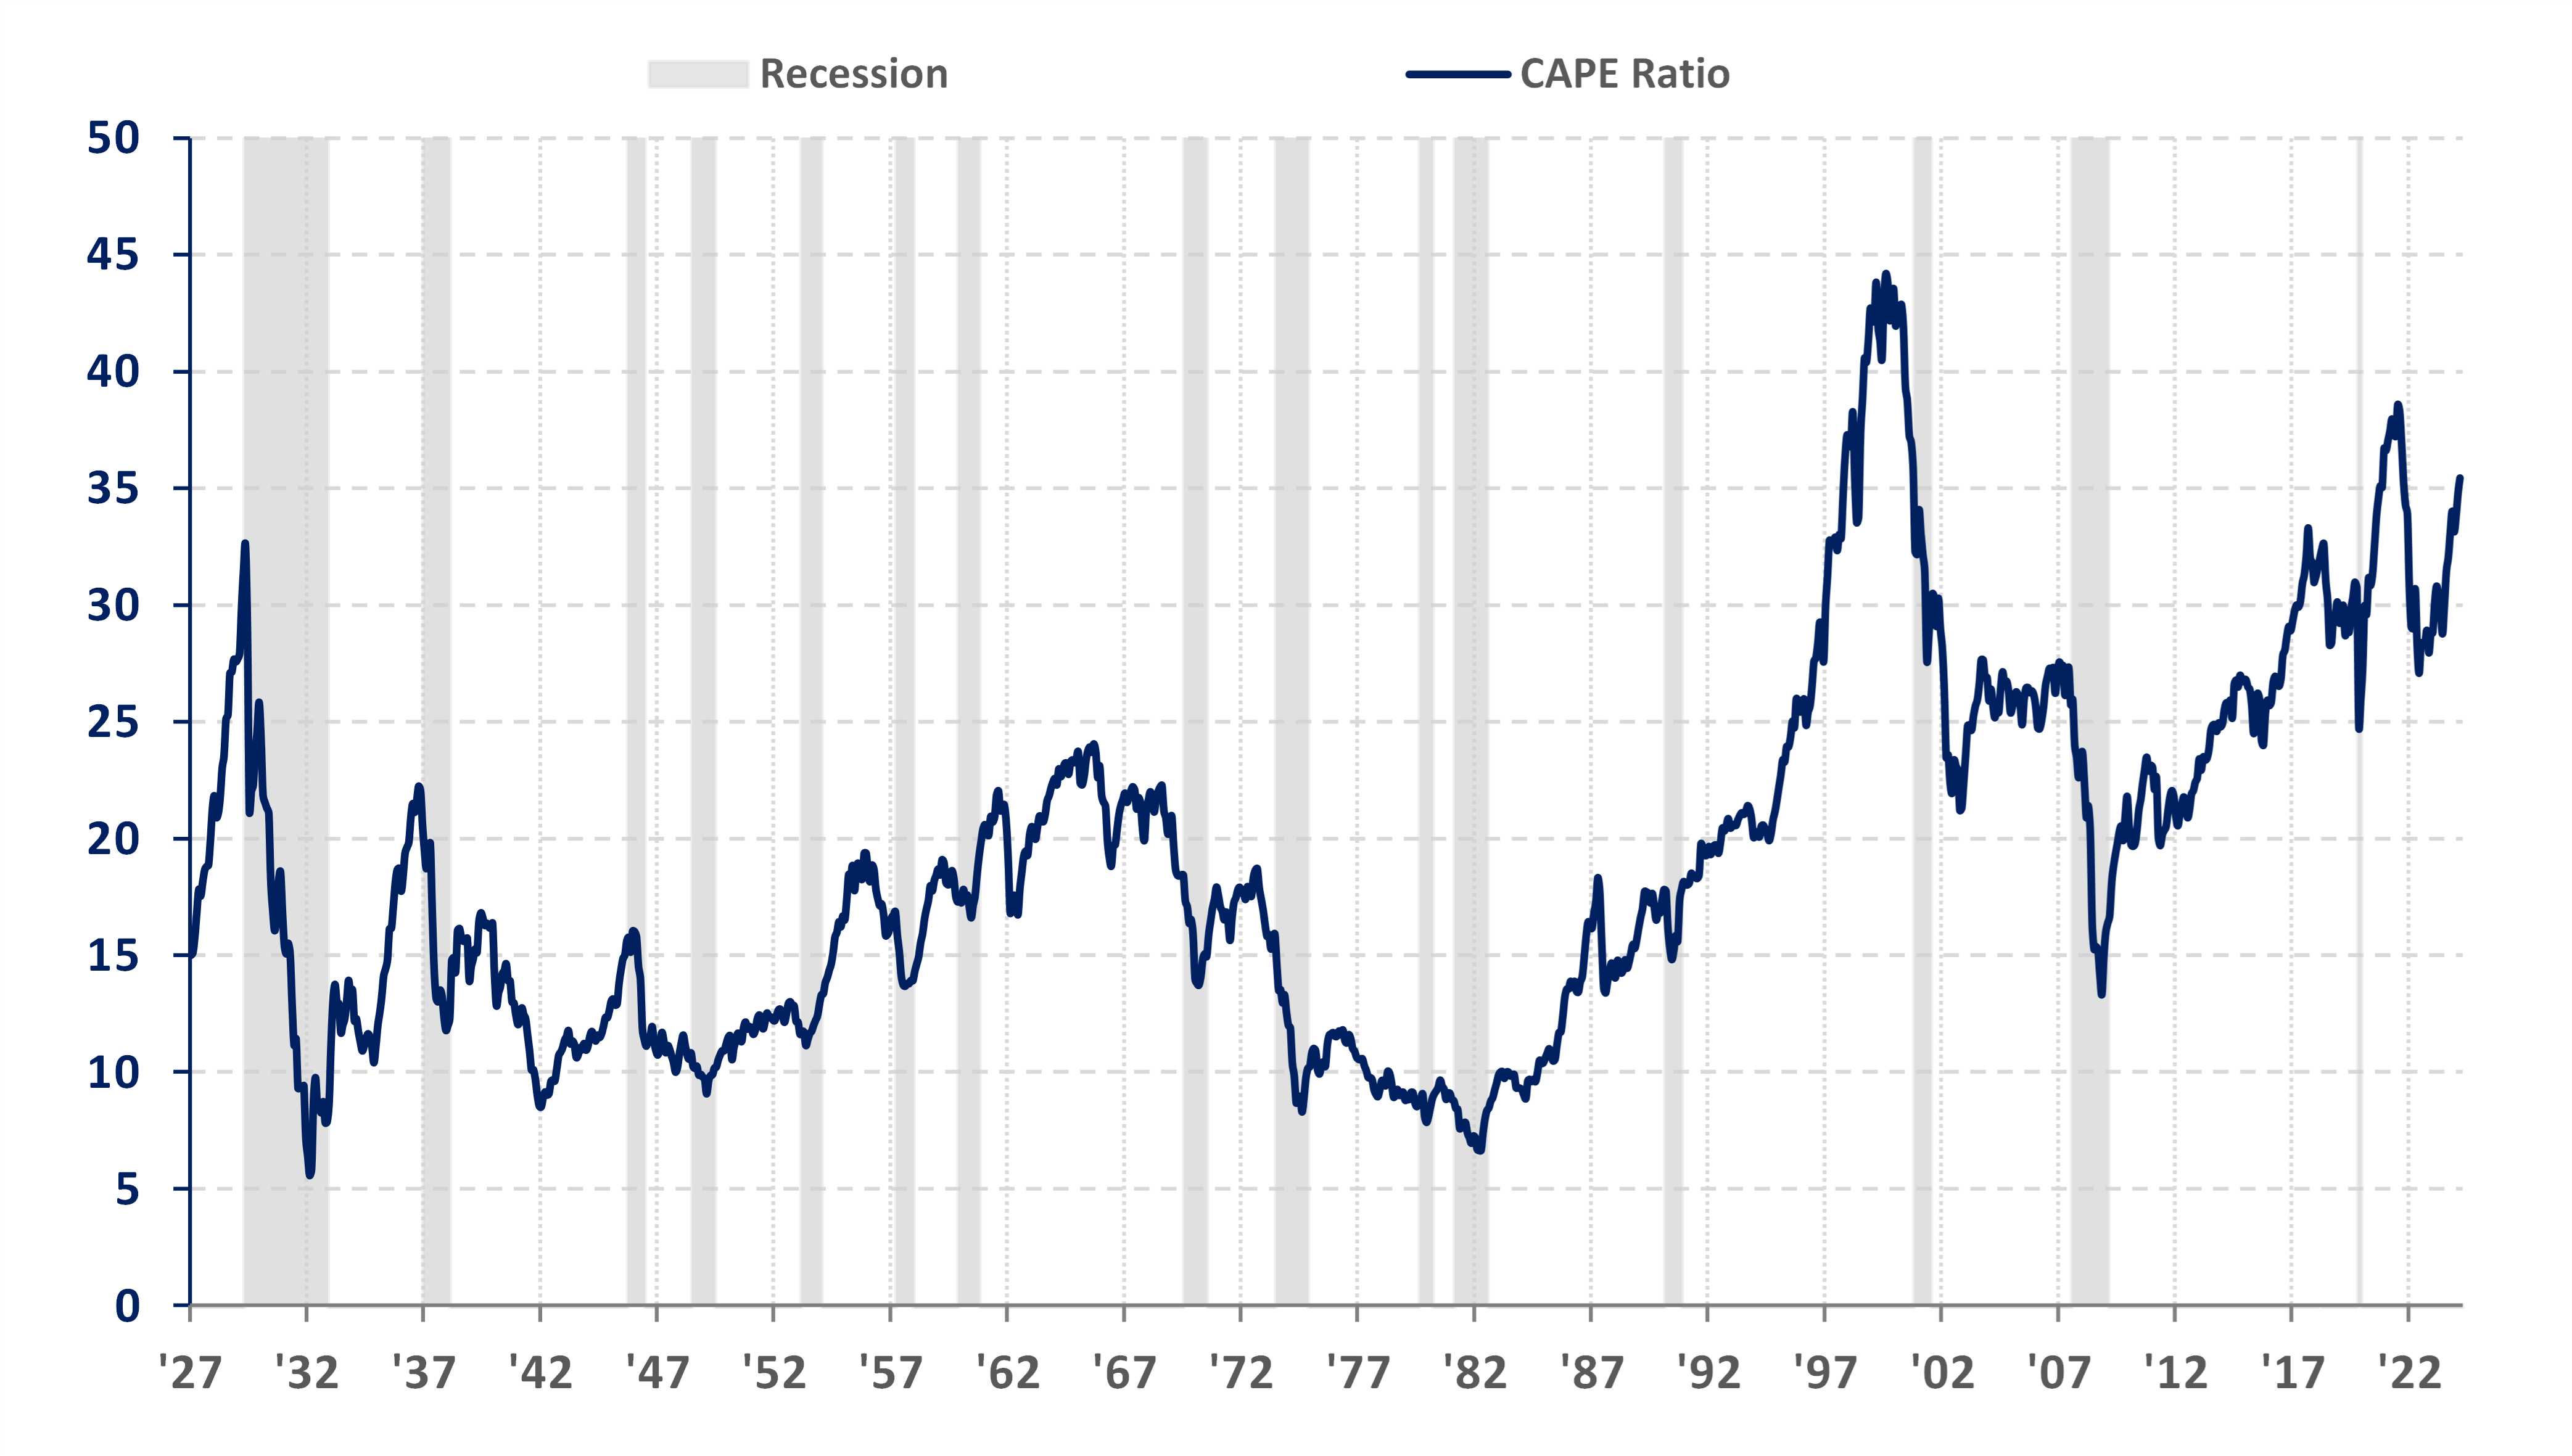
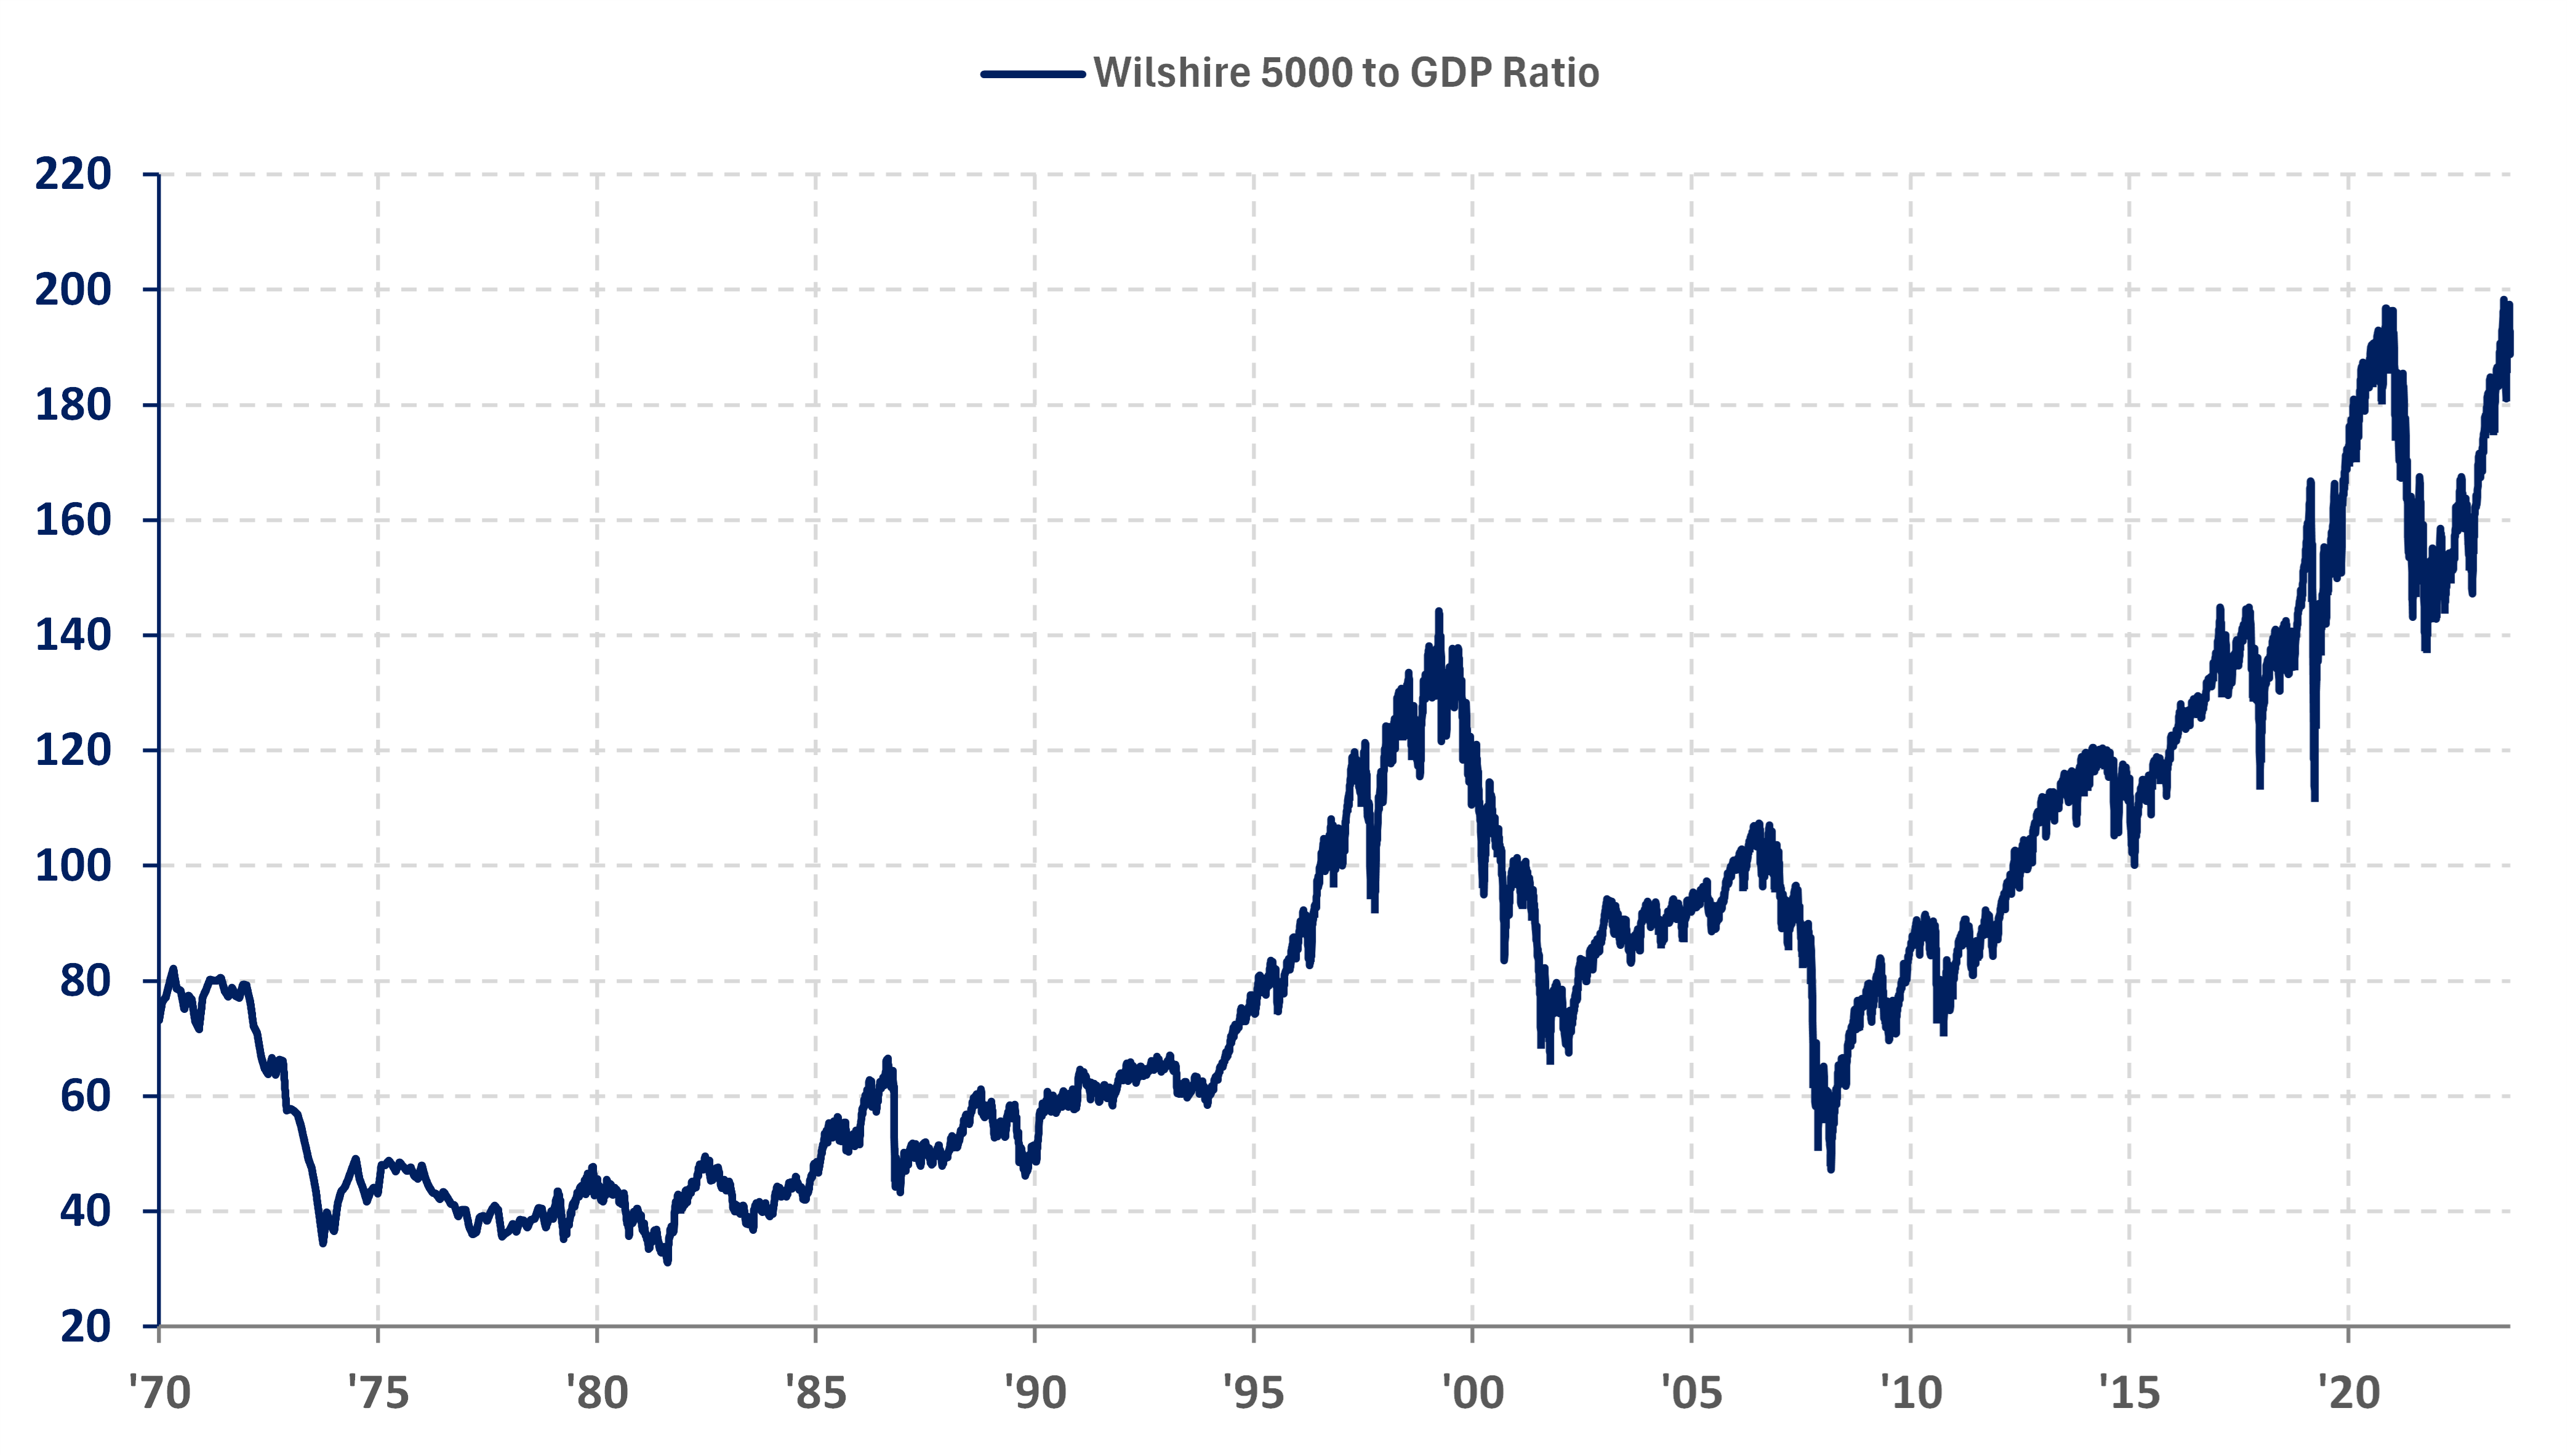
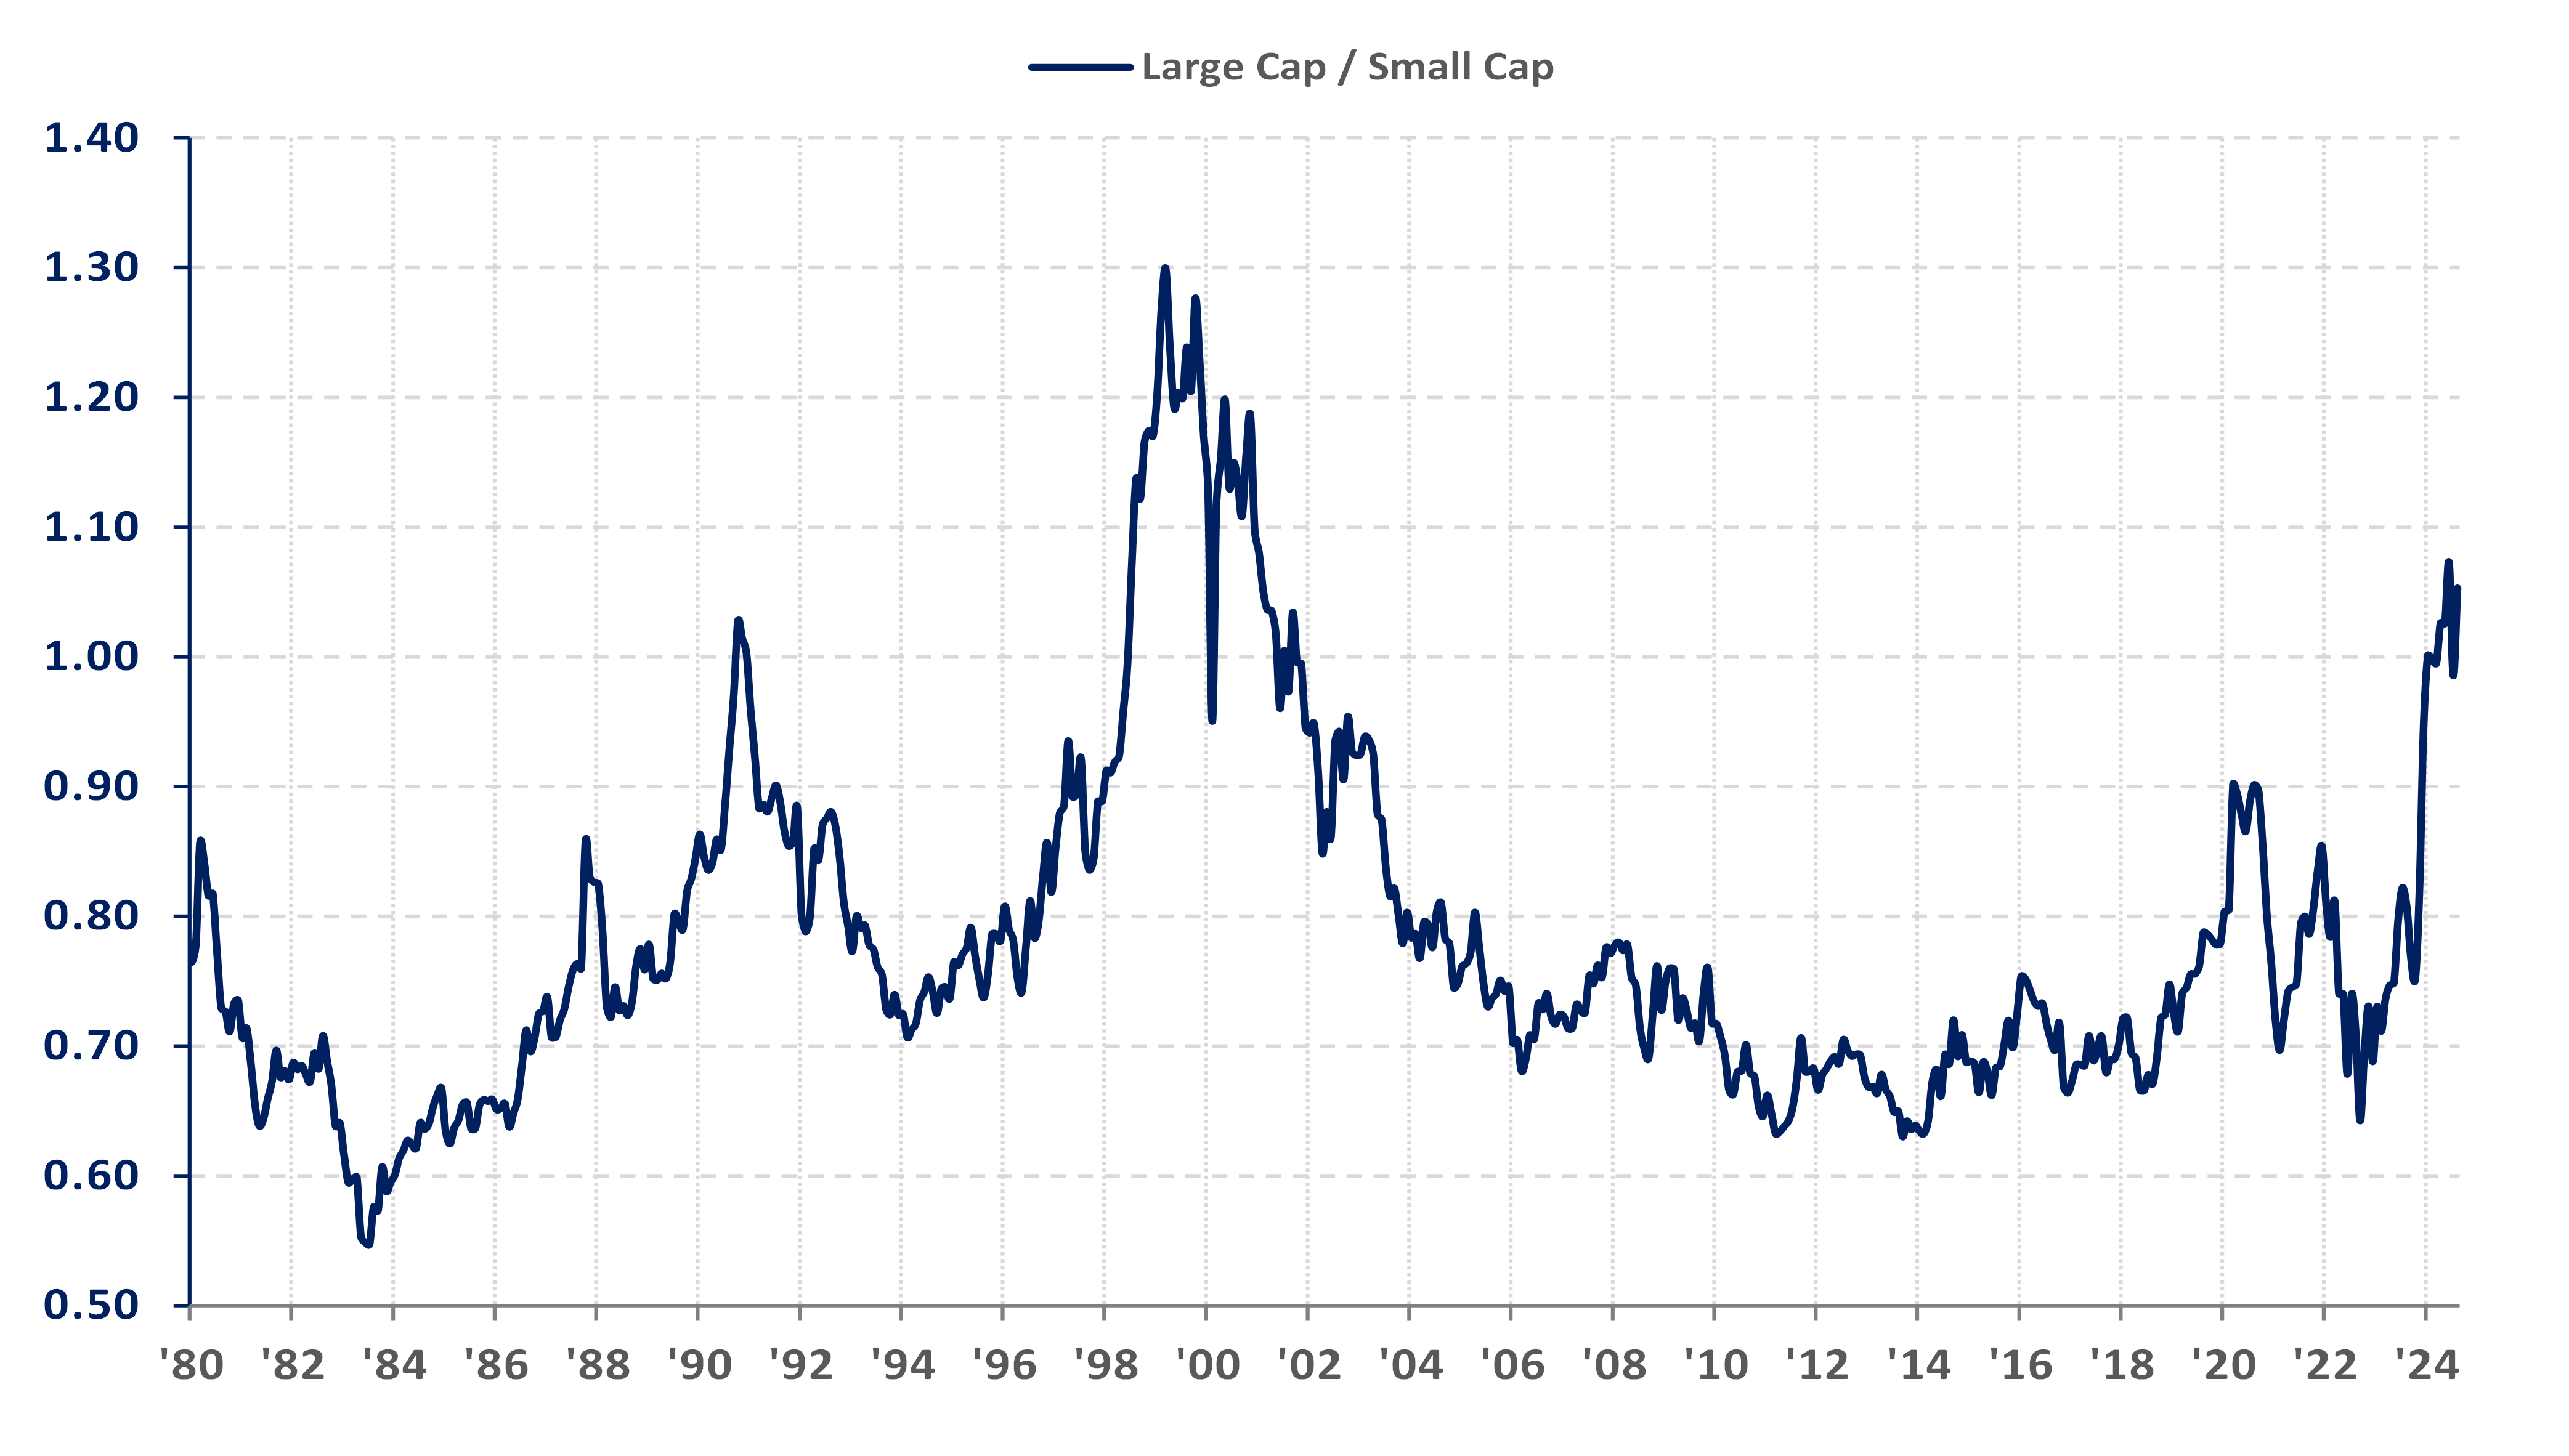
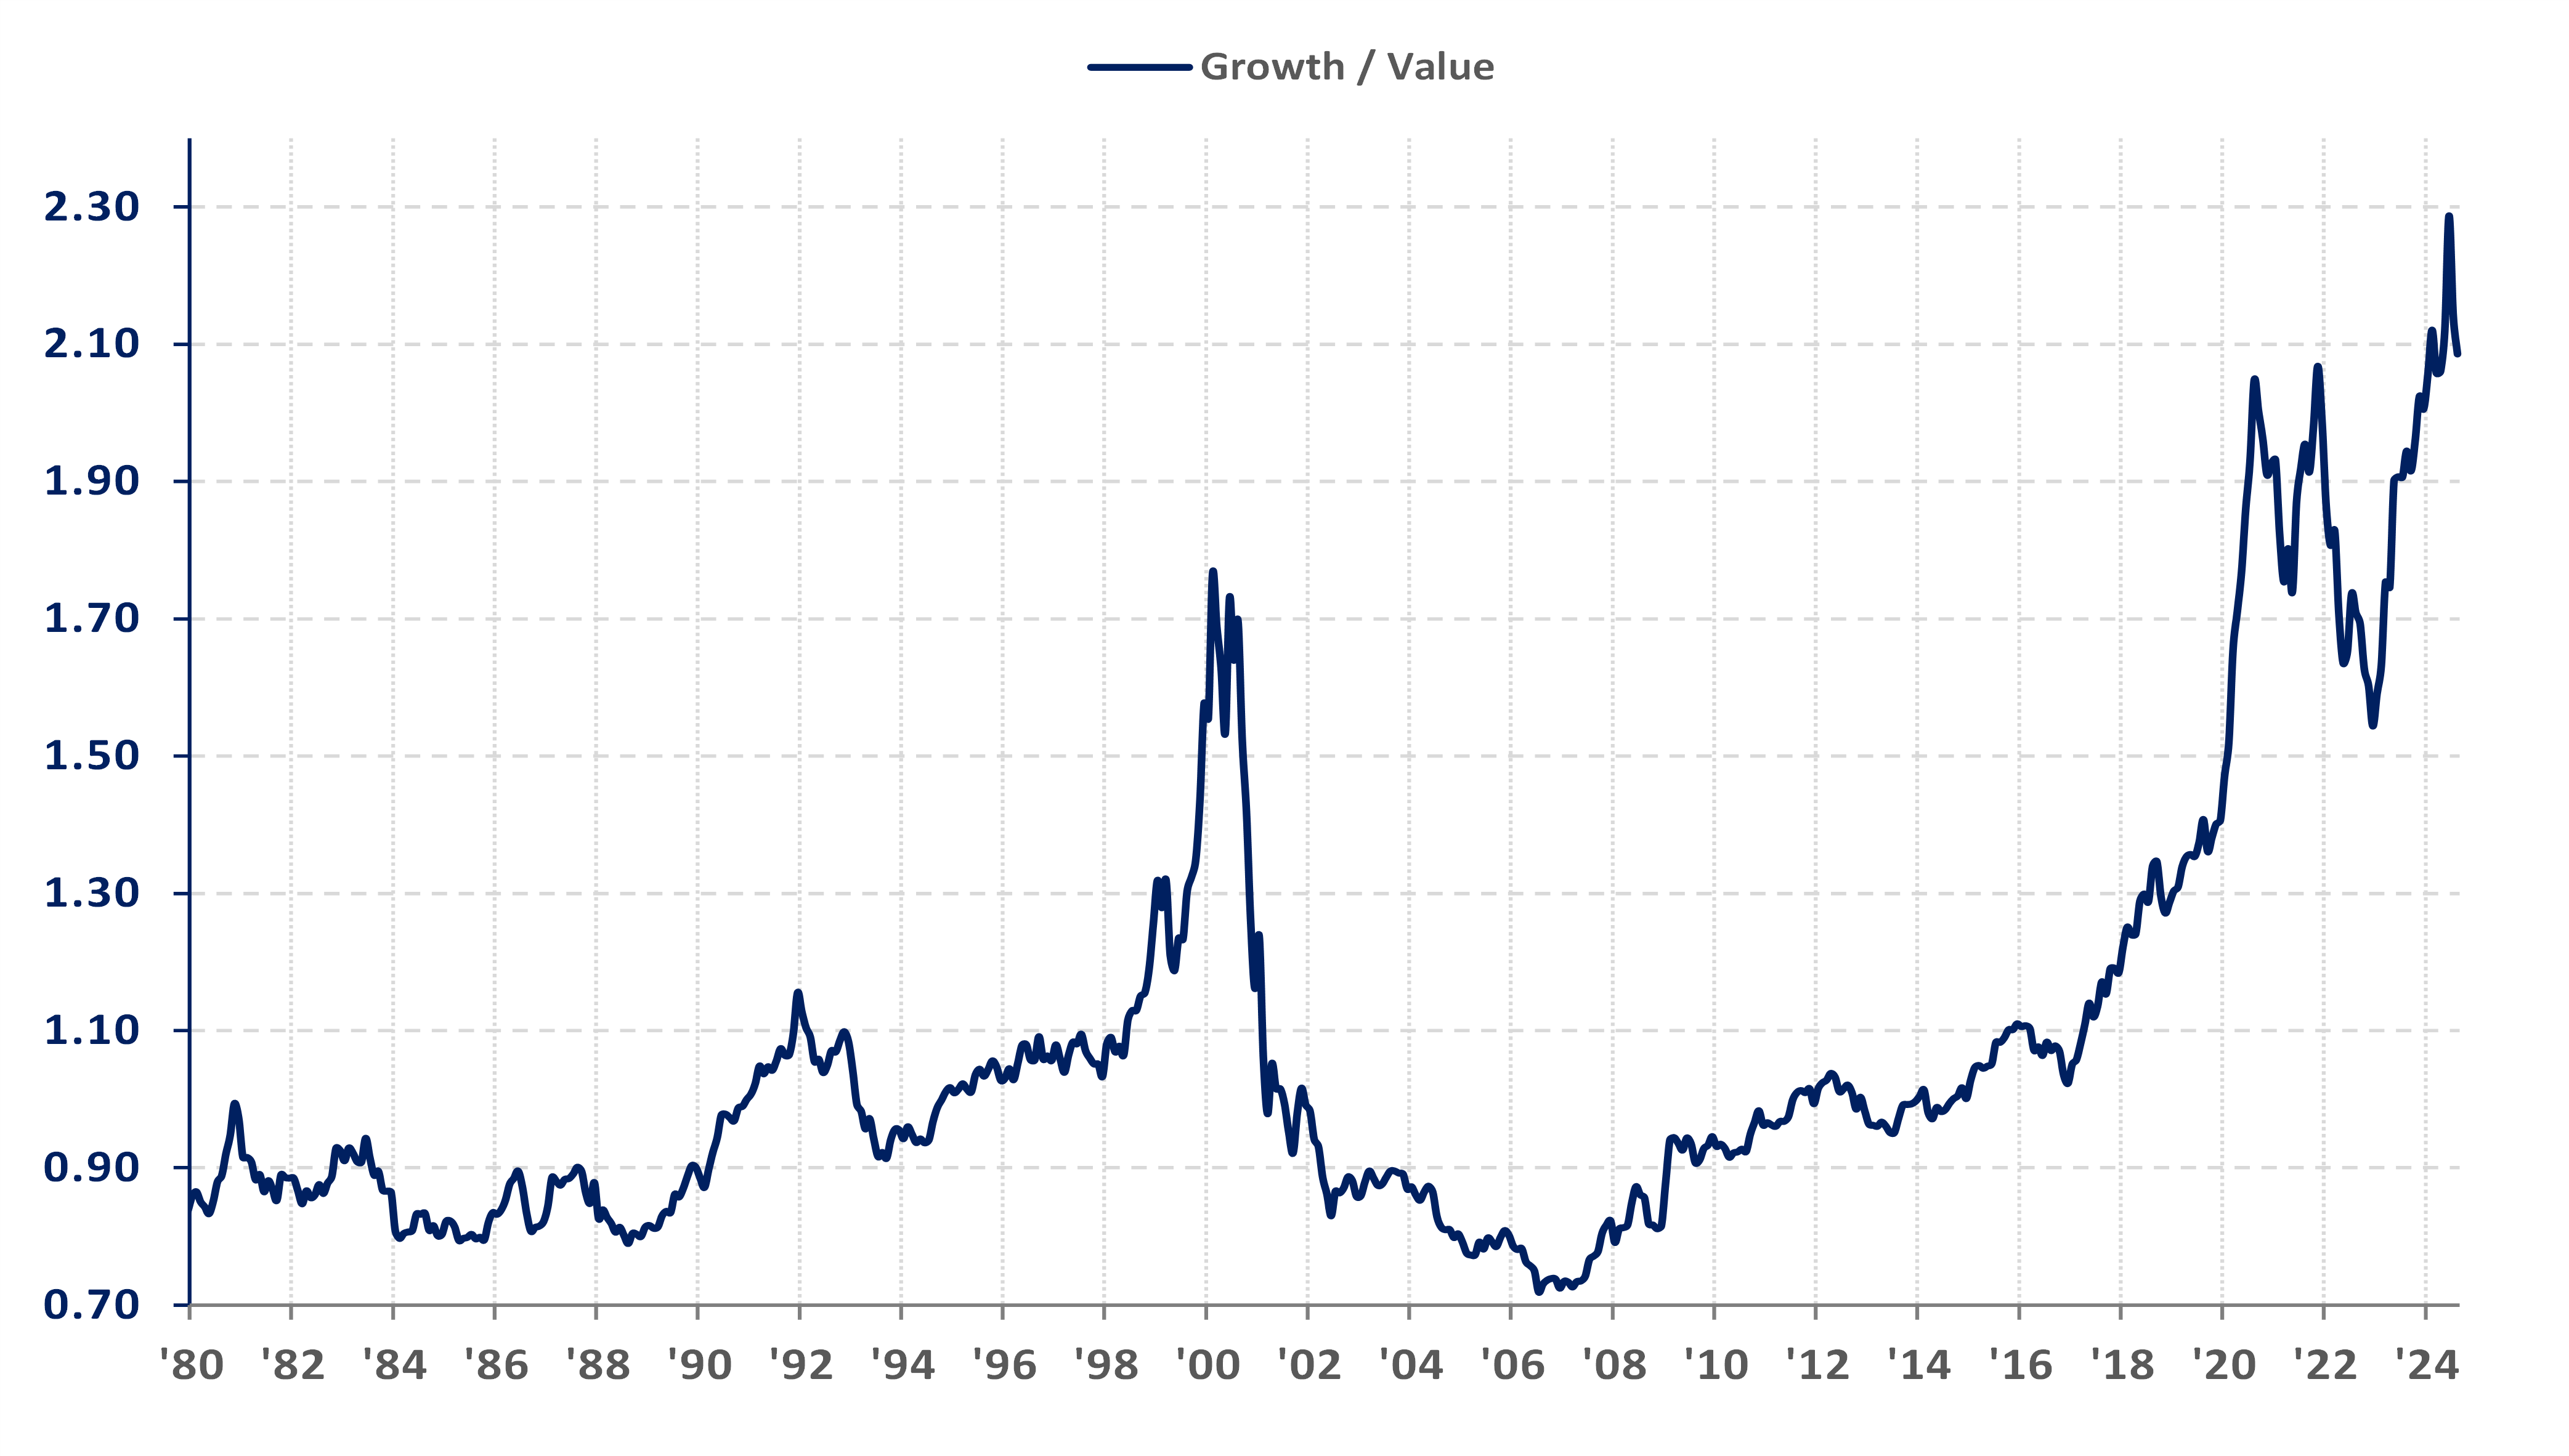
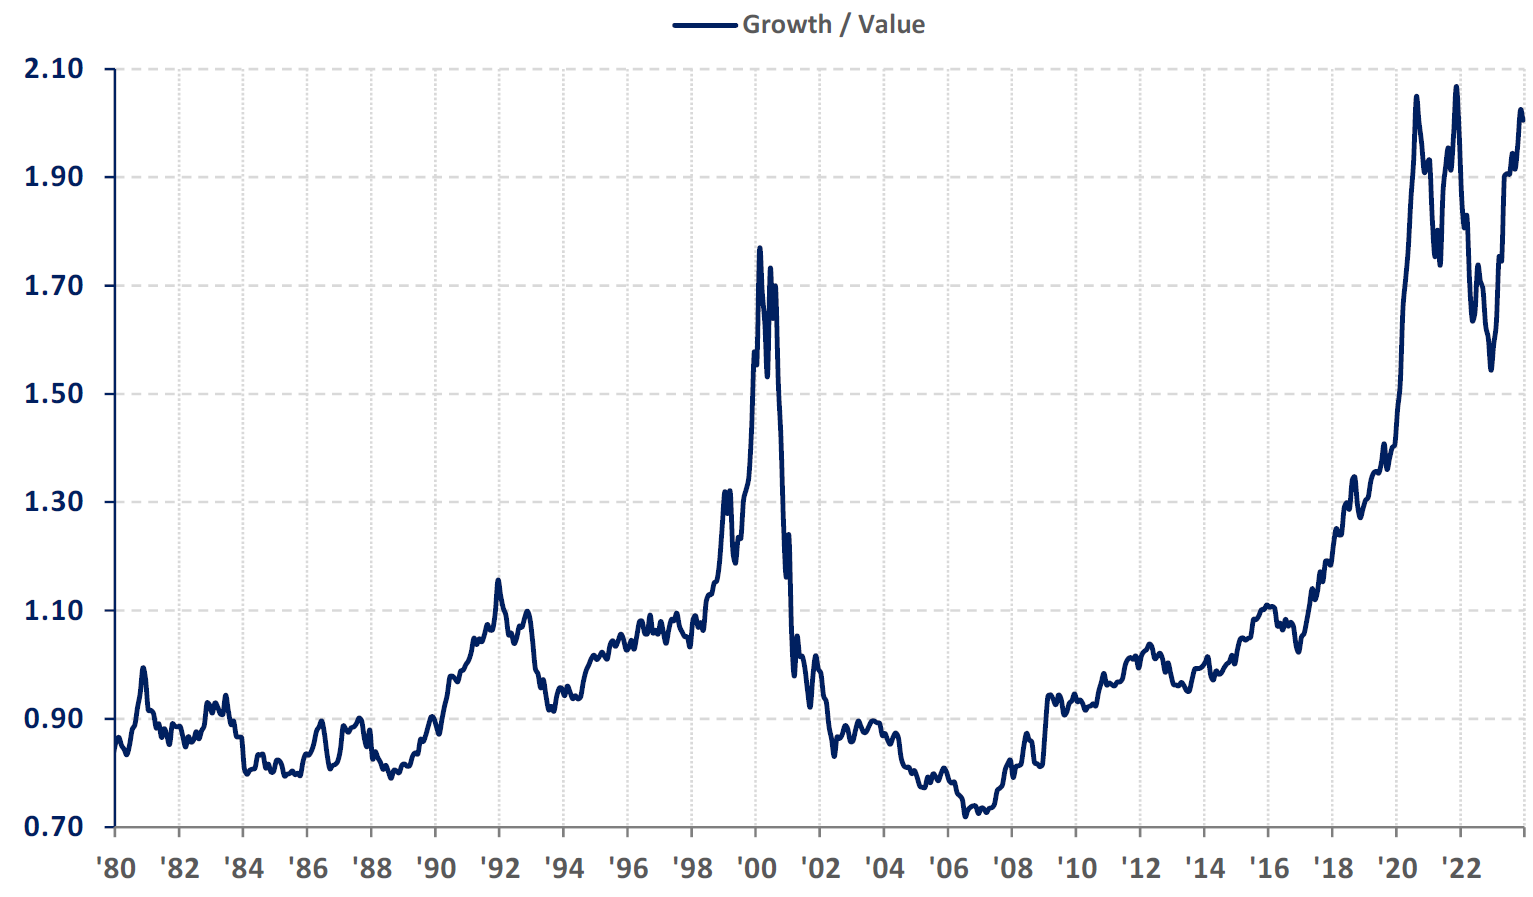
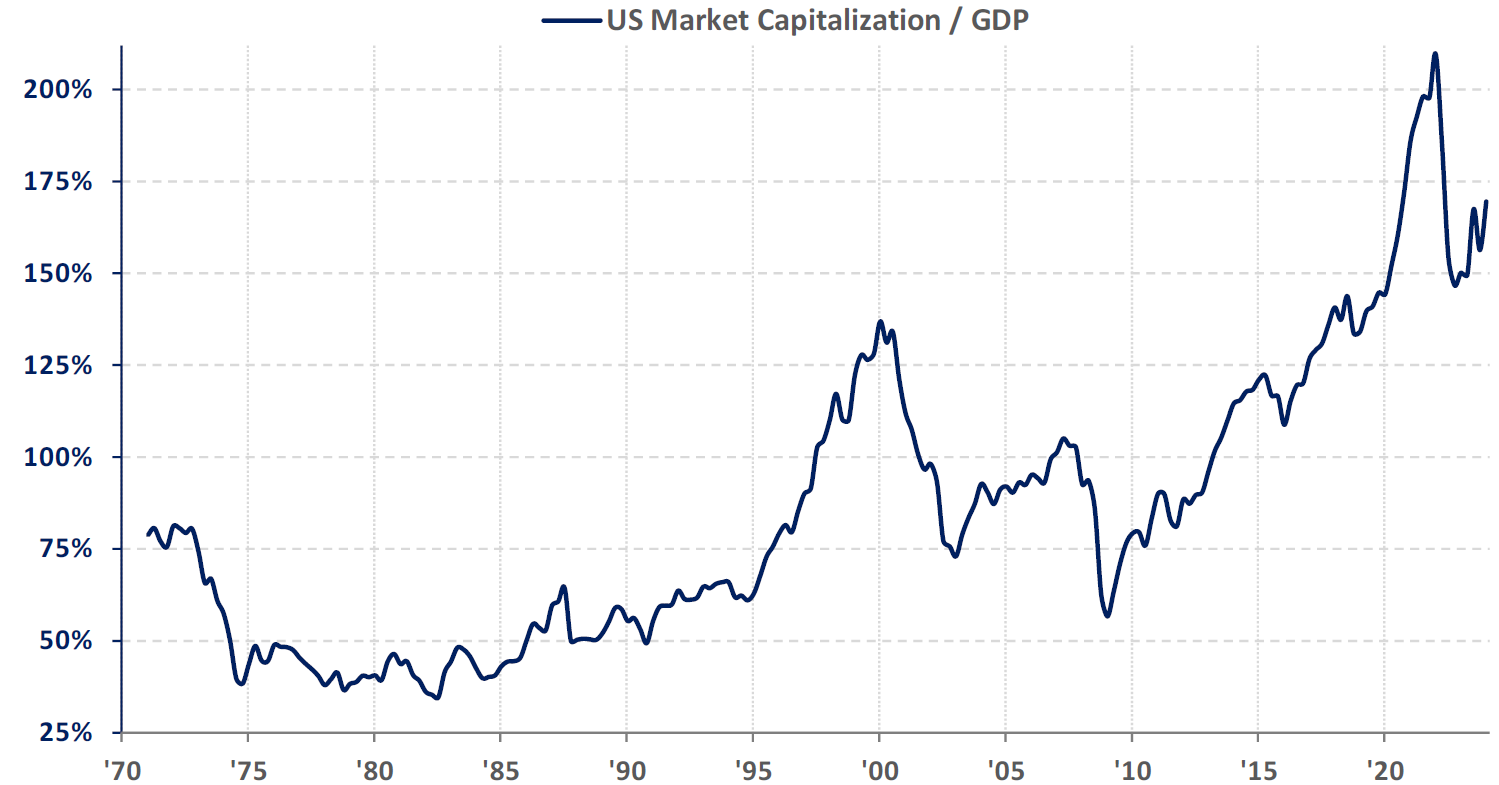
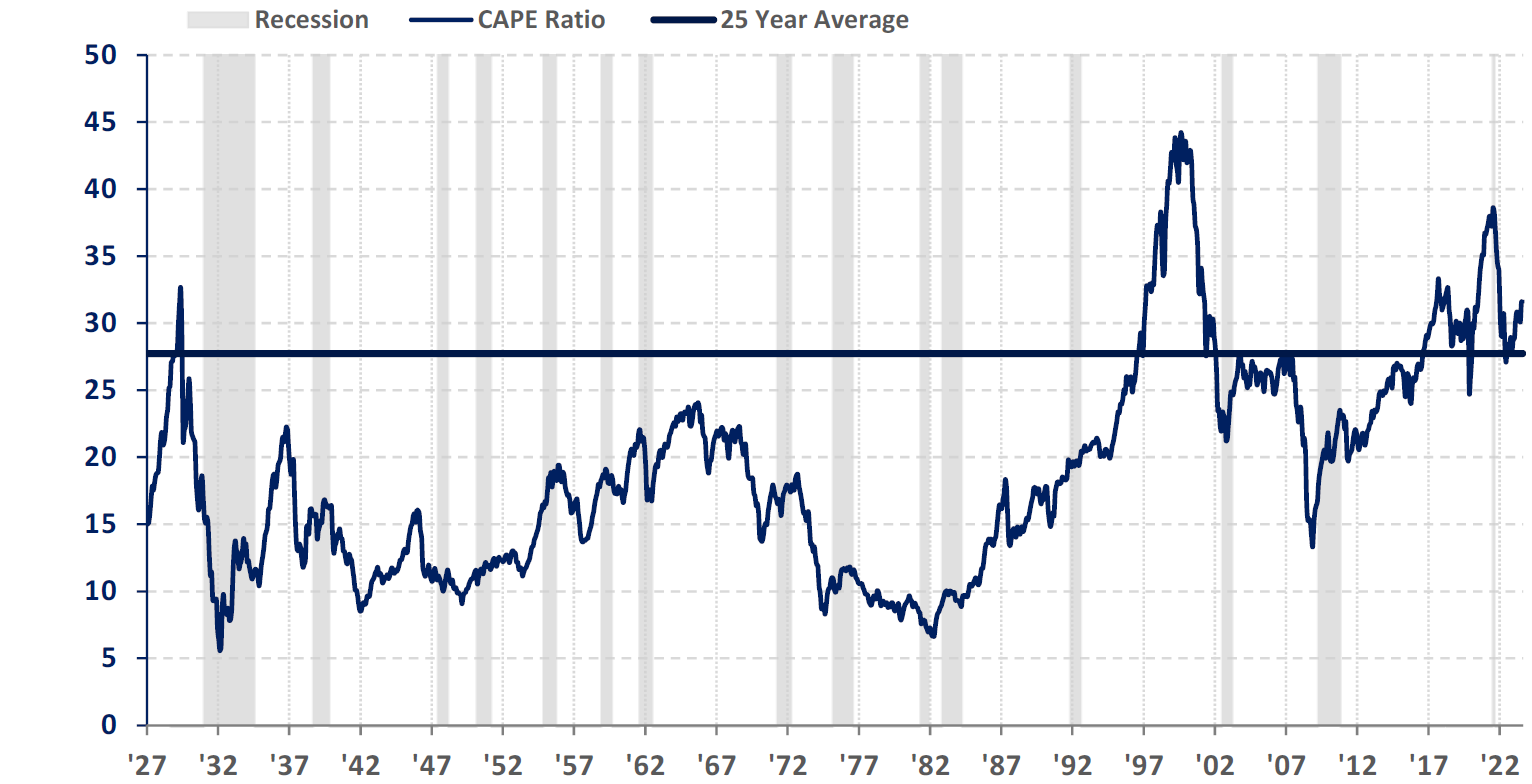
However, we feel that it is our responsibility to point out and to remember that accompanying those new highs in prices were new extremes in many valuation measures. The CAPE (Cyclically Adjusted Price Earnings) Ratio has rebounded to 38 which is very close to the recent post-2000 highs (Chart 1). The ratio of U.S. market capitalization to GDP (Warren Buffet’s favorite valuation indicator) is at the highest level in modern history (which could explain why Buffet is sitting on over $300 billion of cash!). (Chart 2). Large capitalization stocks are the most richly valued relative to those of small companies since 2000 (Chart 3). Growth stocks are well above their relative valuation peaks compared to value stocks seen in 2000, 2020 and 2022 (Chart 4).
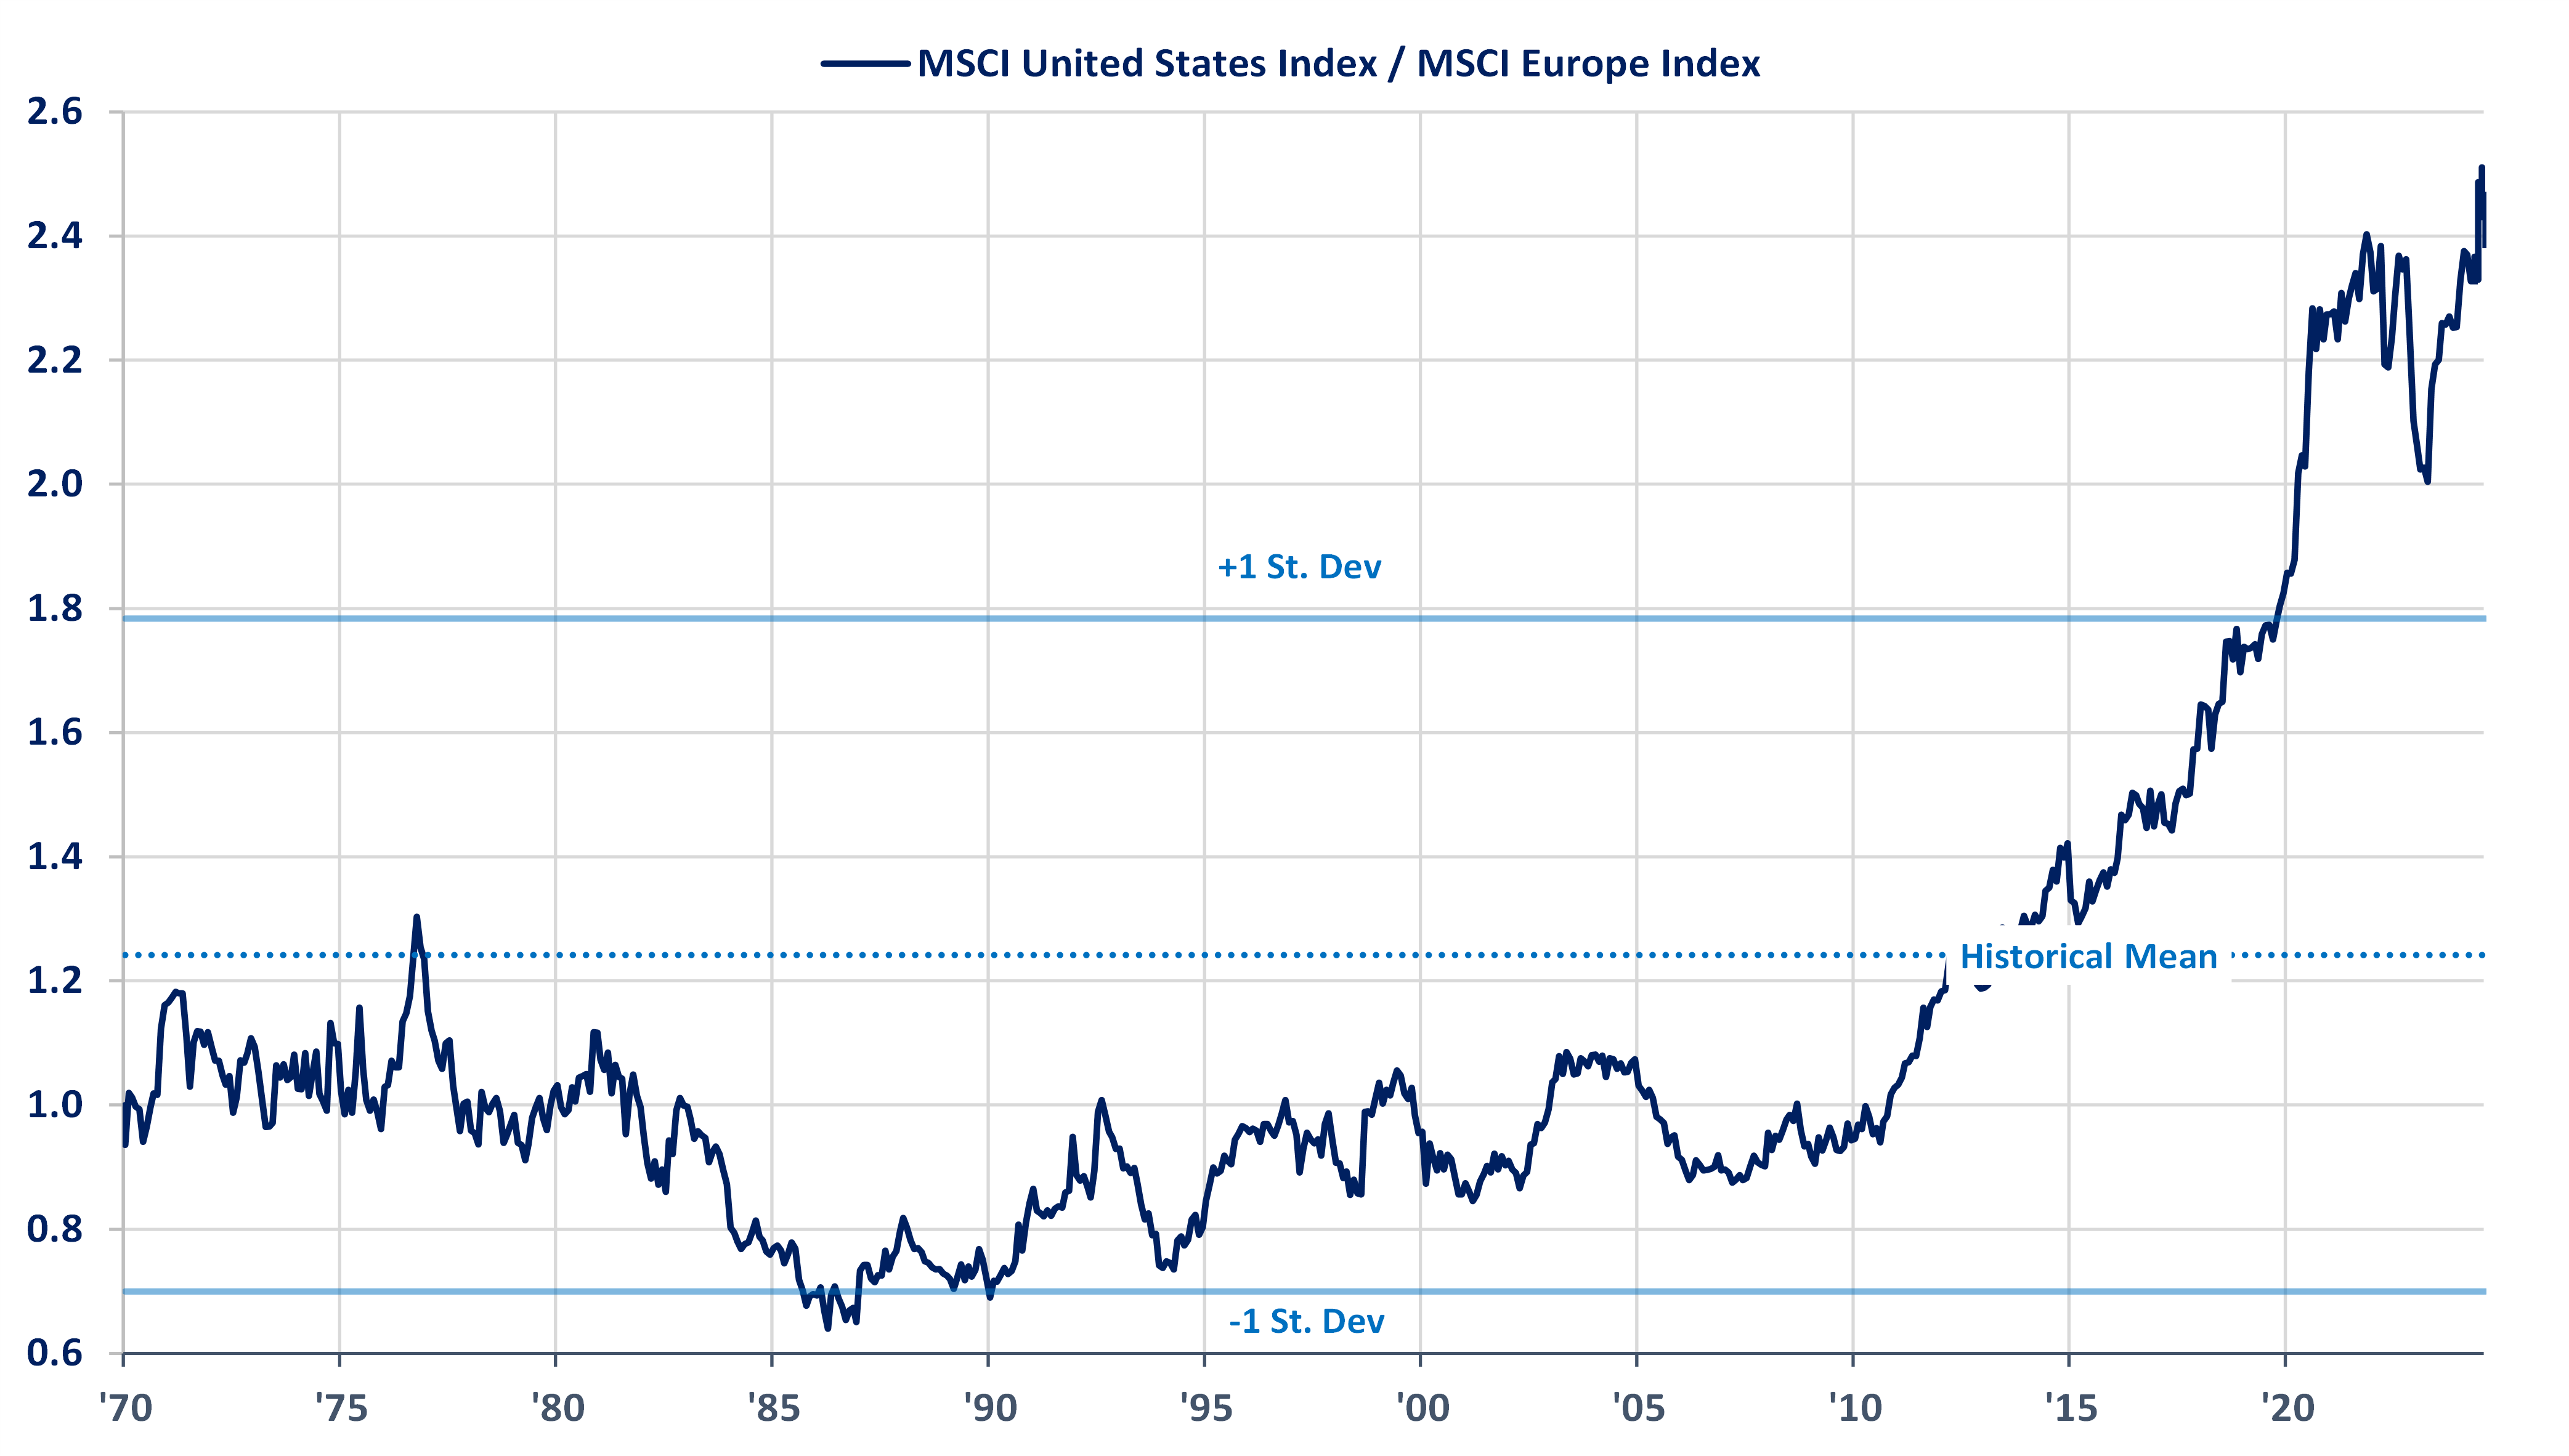
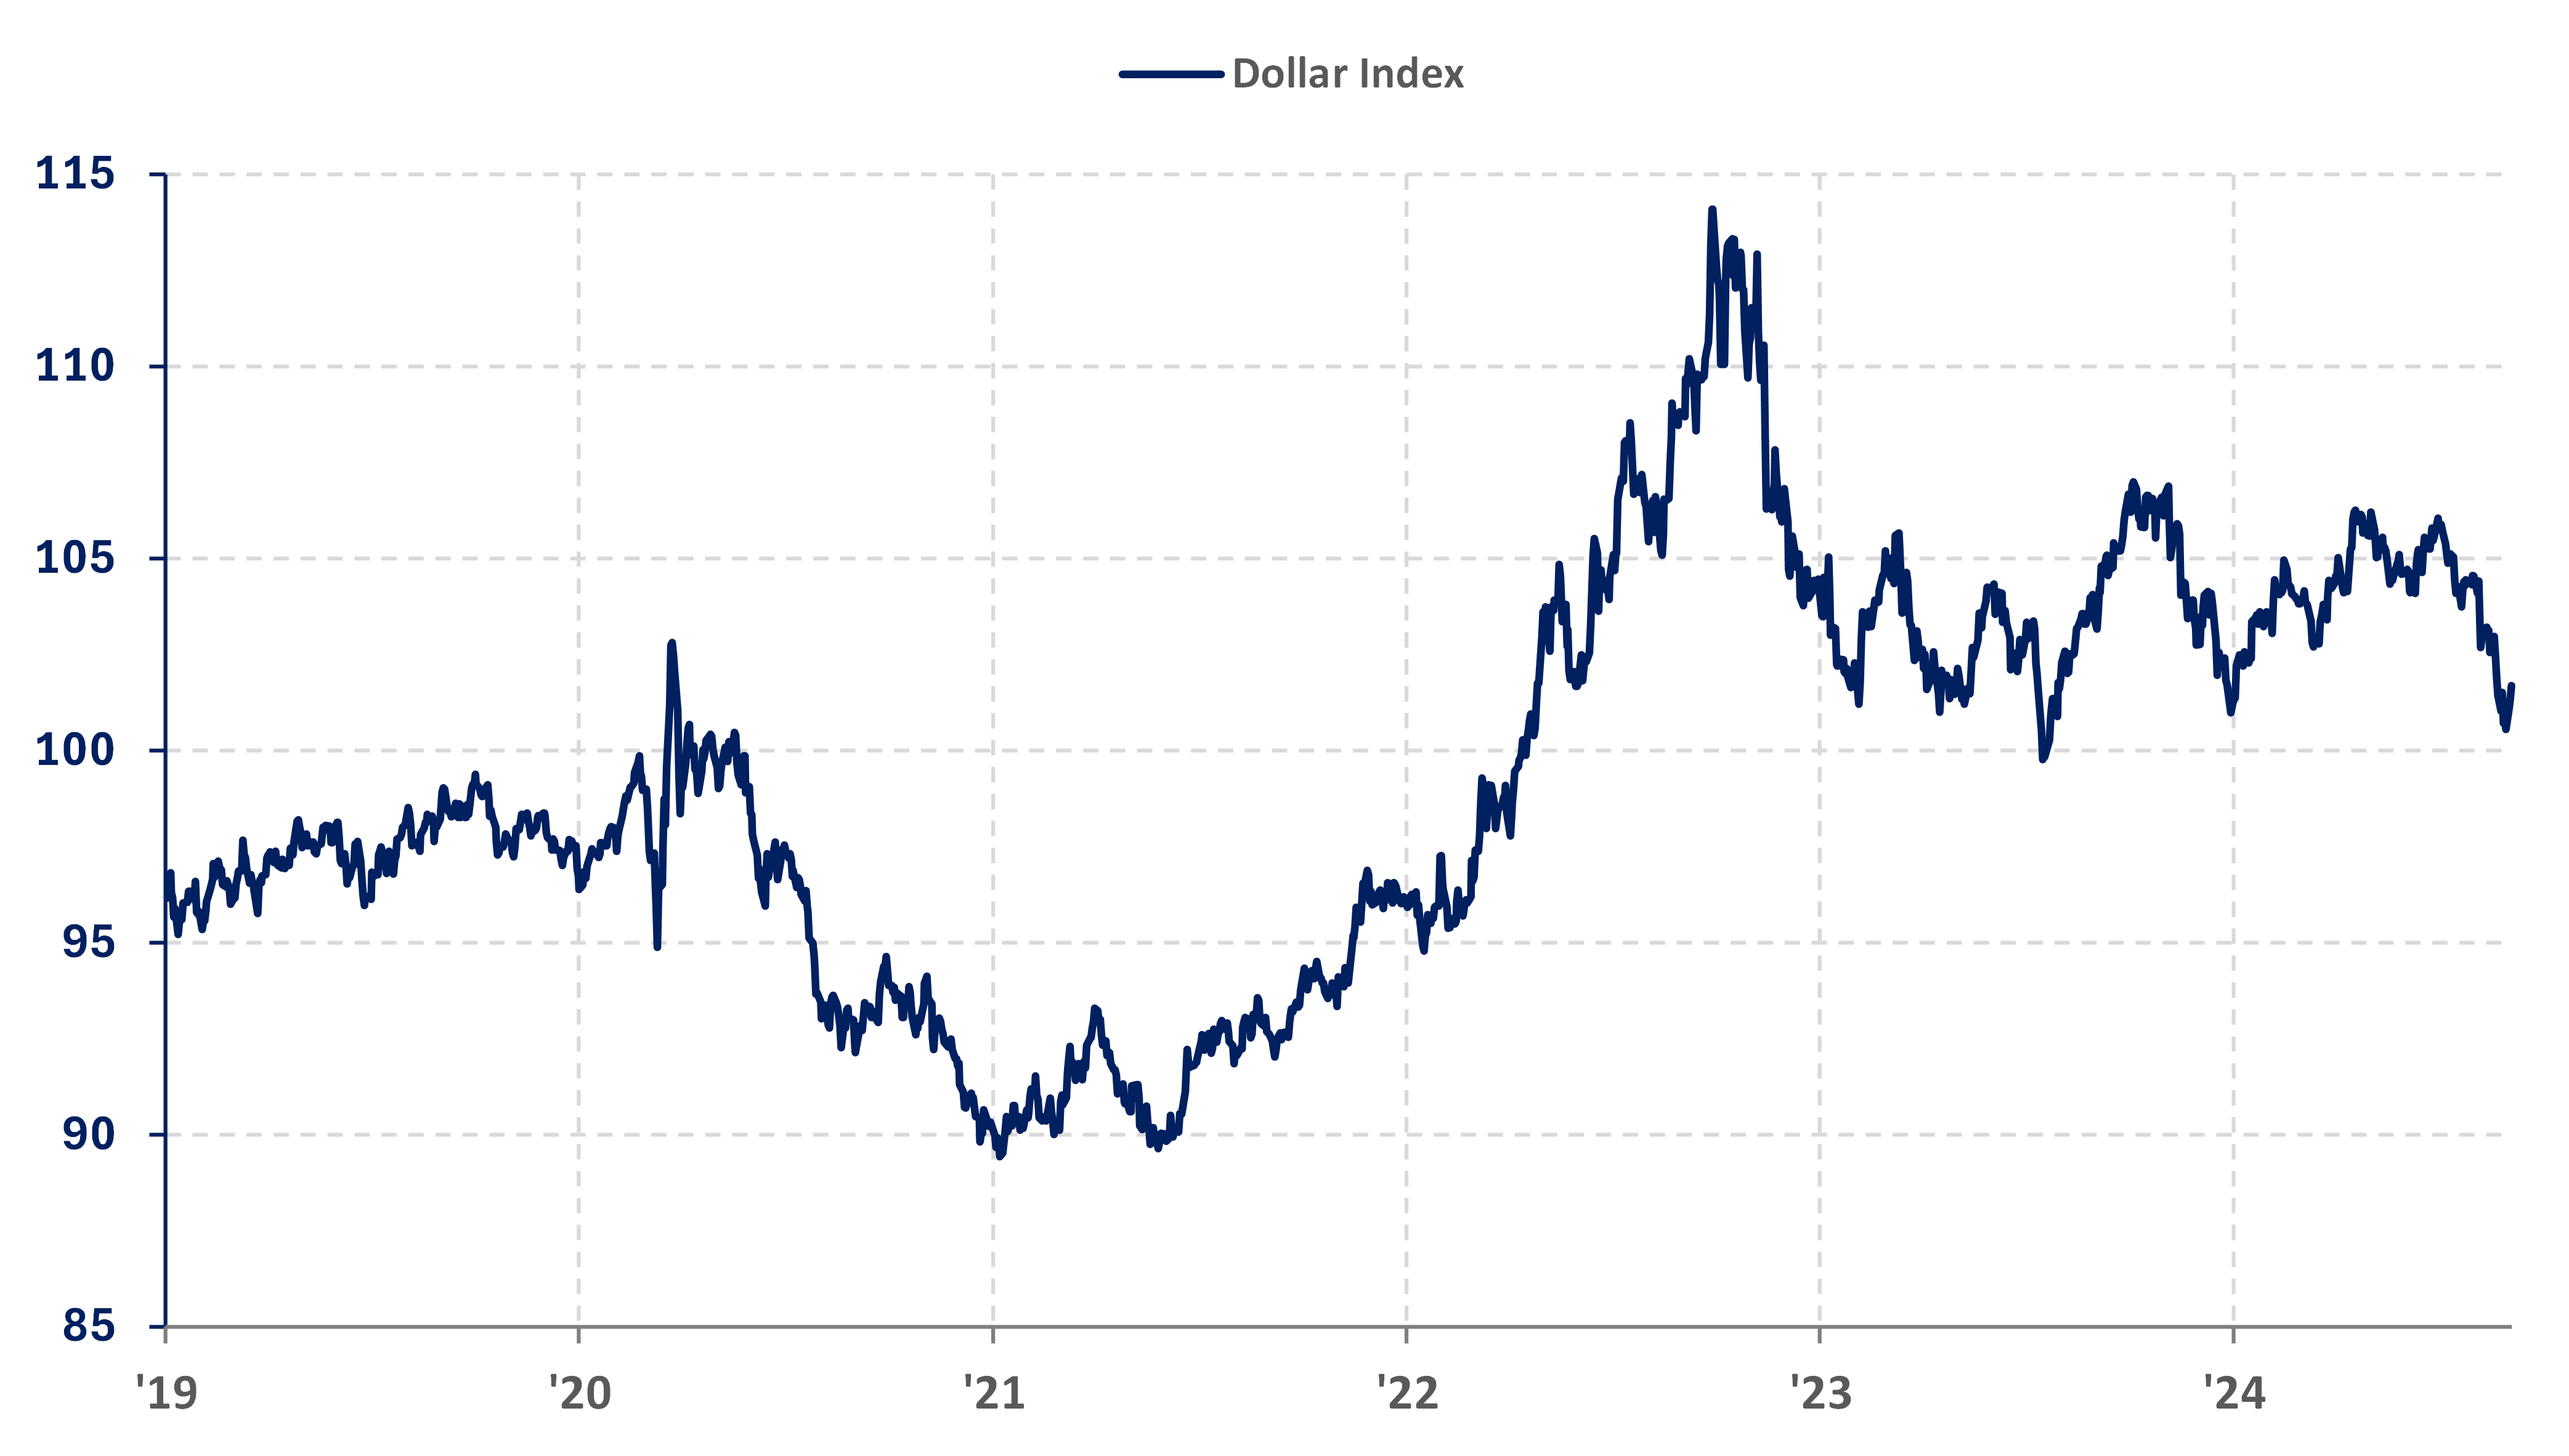
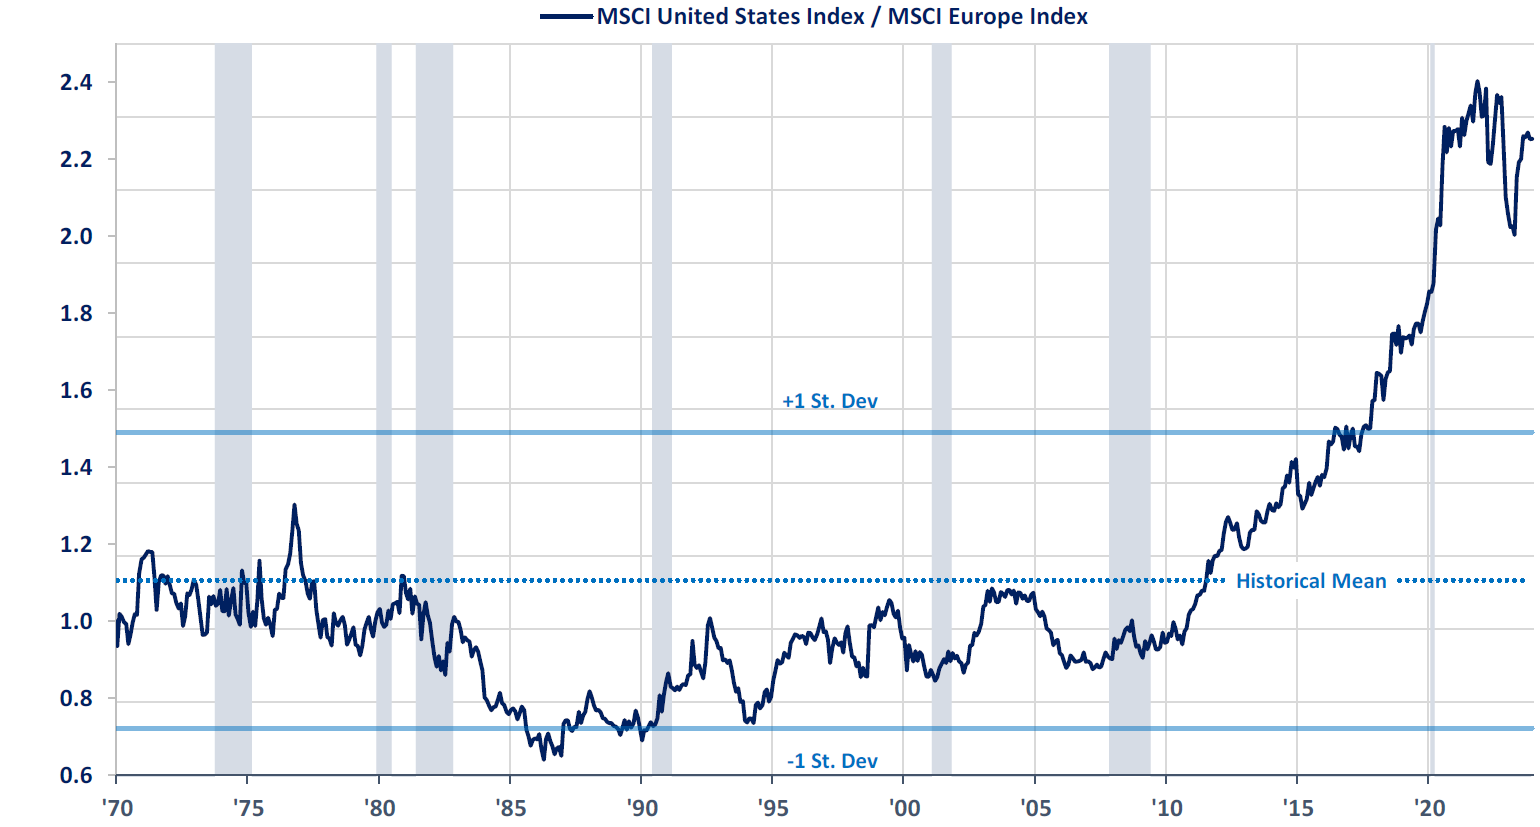
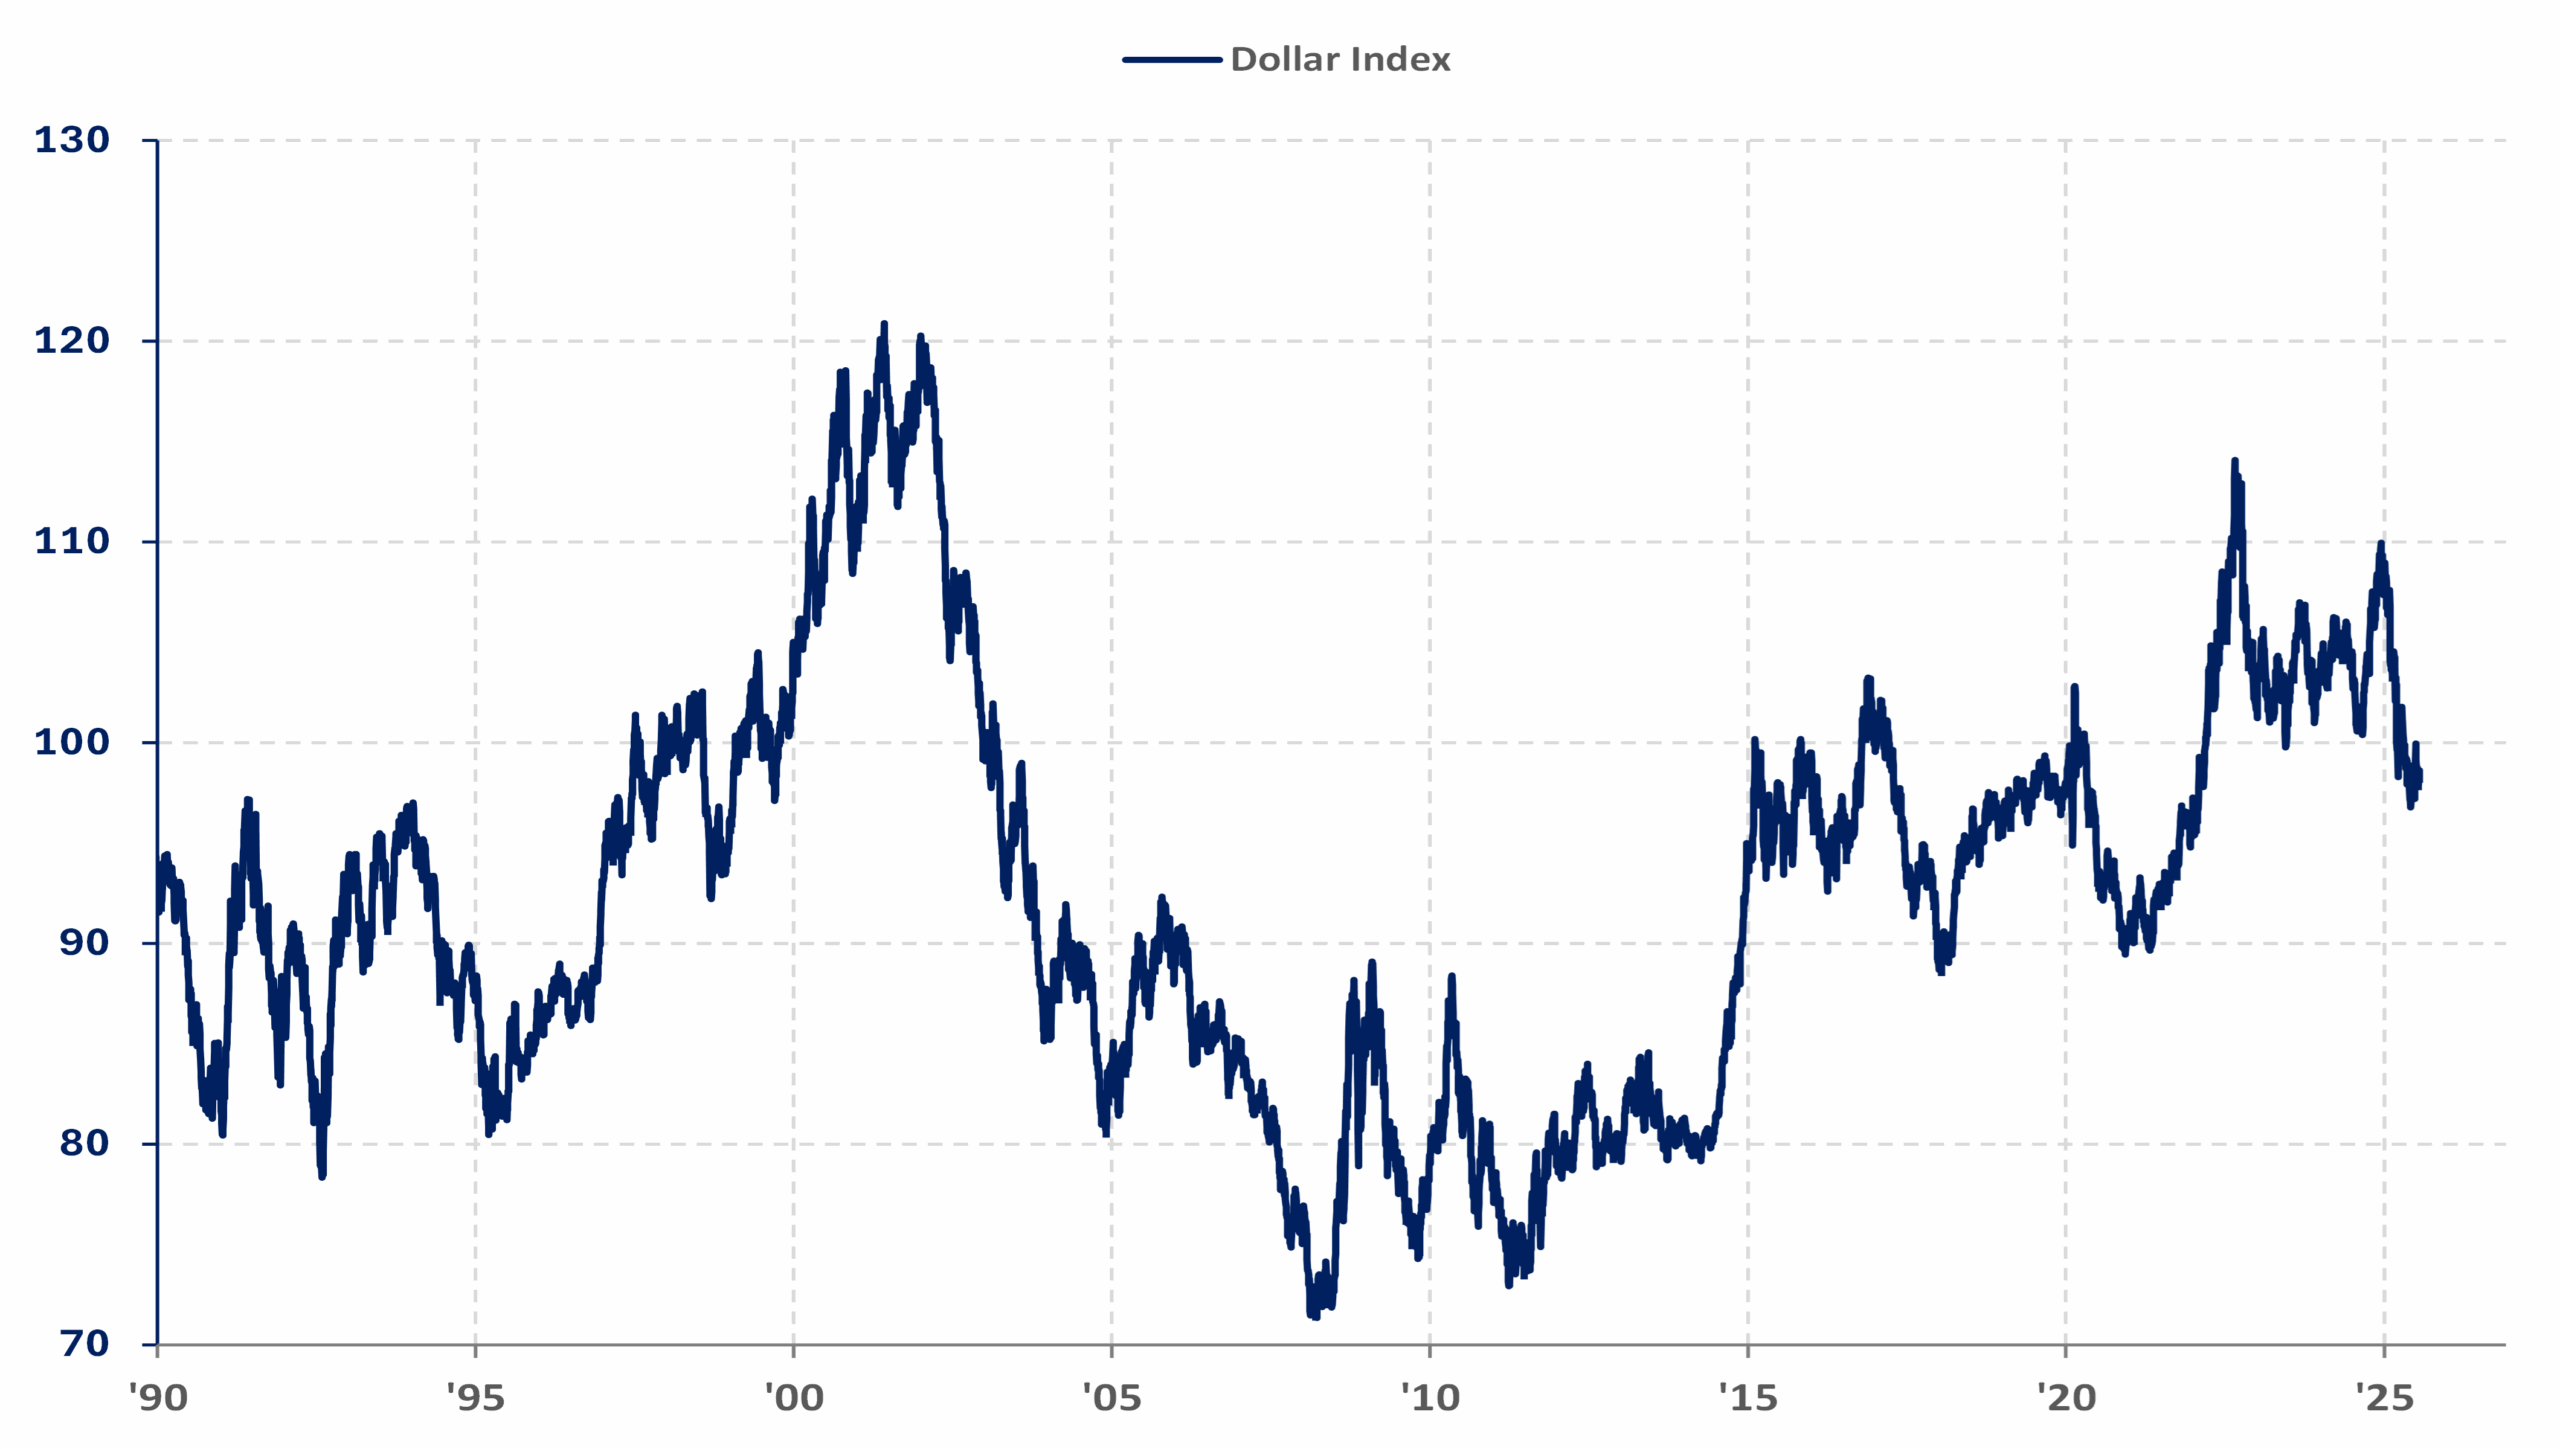
One of the few changes that has occurred is that non-U.S. stock markets have been outperforming U.S. markets so far this year (Chart 5). For several years we have been pointing out the extreme valuation disparity between U.S. and non-U.S. markets. There have been several reasons to explain the divergent performances, but a major one was the bull market in the U.S. dollar over much of the last seventeen years. That appears to have changed as the dollar shows signs of having technically broken down and potentially entering a bear market (Chart 6). We believe that trend has a high likelihood of continuing as the Federal Reserve is likely to resume cutting interest rates. On a longer-term basis, President Trump’s expressed desire for a weaker dollar and his seeming intention to weaken the independence of the U.S. central bank could make this a more pronounced trend.
We expect that gold will be a beneficiary of a weaker dollar, the diminishment in Federal Reserve independence, and the current volatility in U.S. economic and geopolitical policy. The metal has been in a bull market for more than two years and is up over 28% so far this year. We believe that all portfolios should have at least a small exposure to gold as a hedge against a resurgence in inflation and as a way to profit from the potential longer-term decline in the dollar.
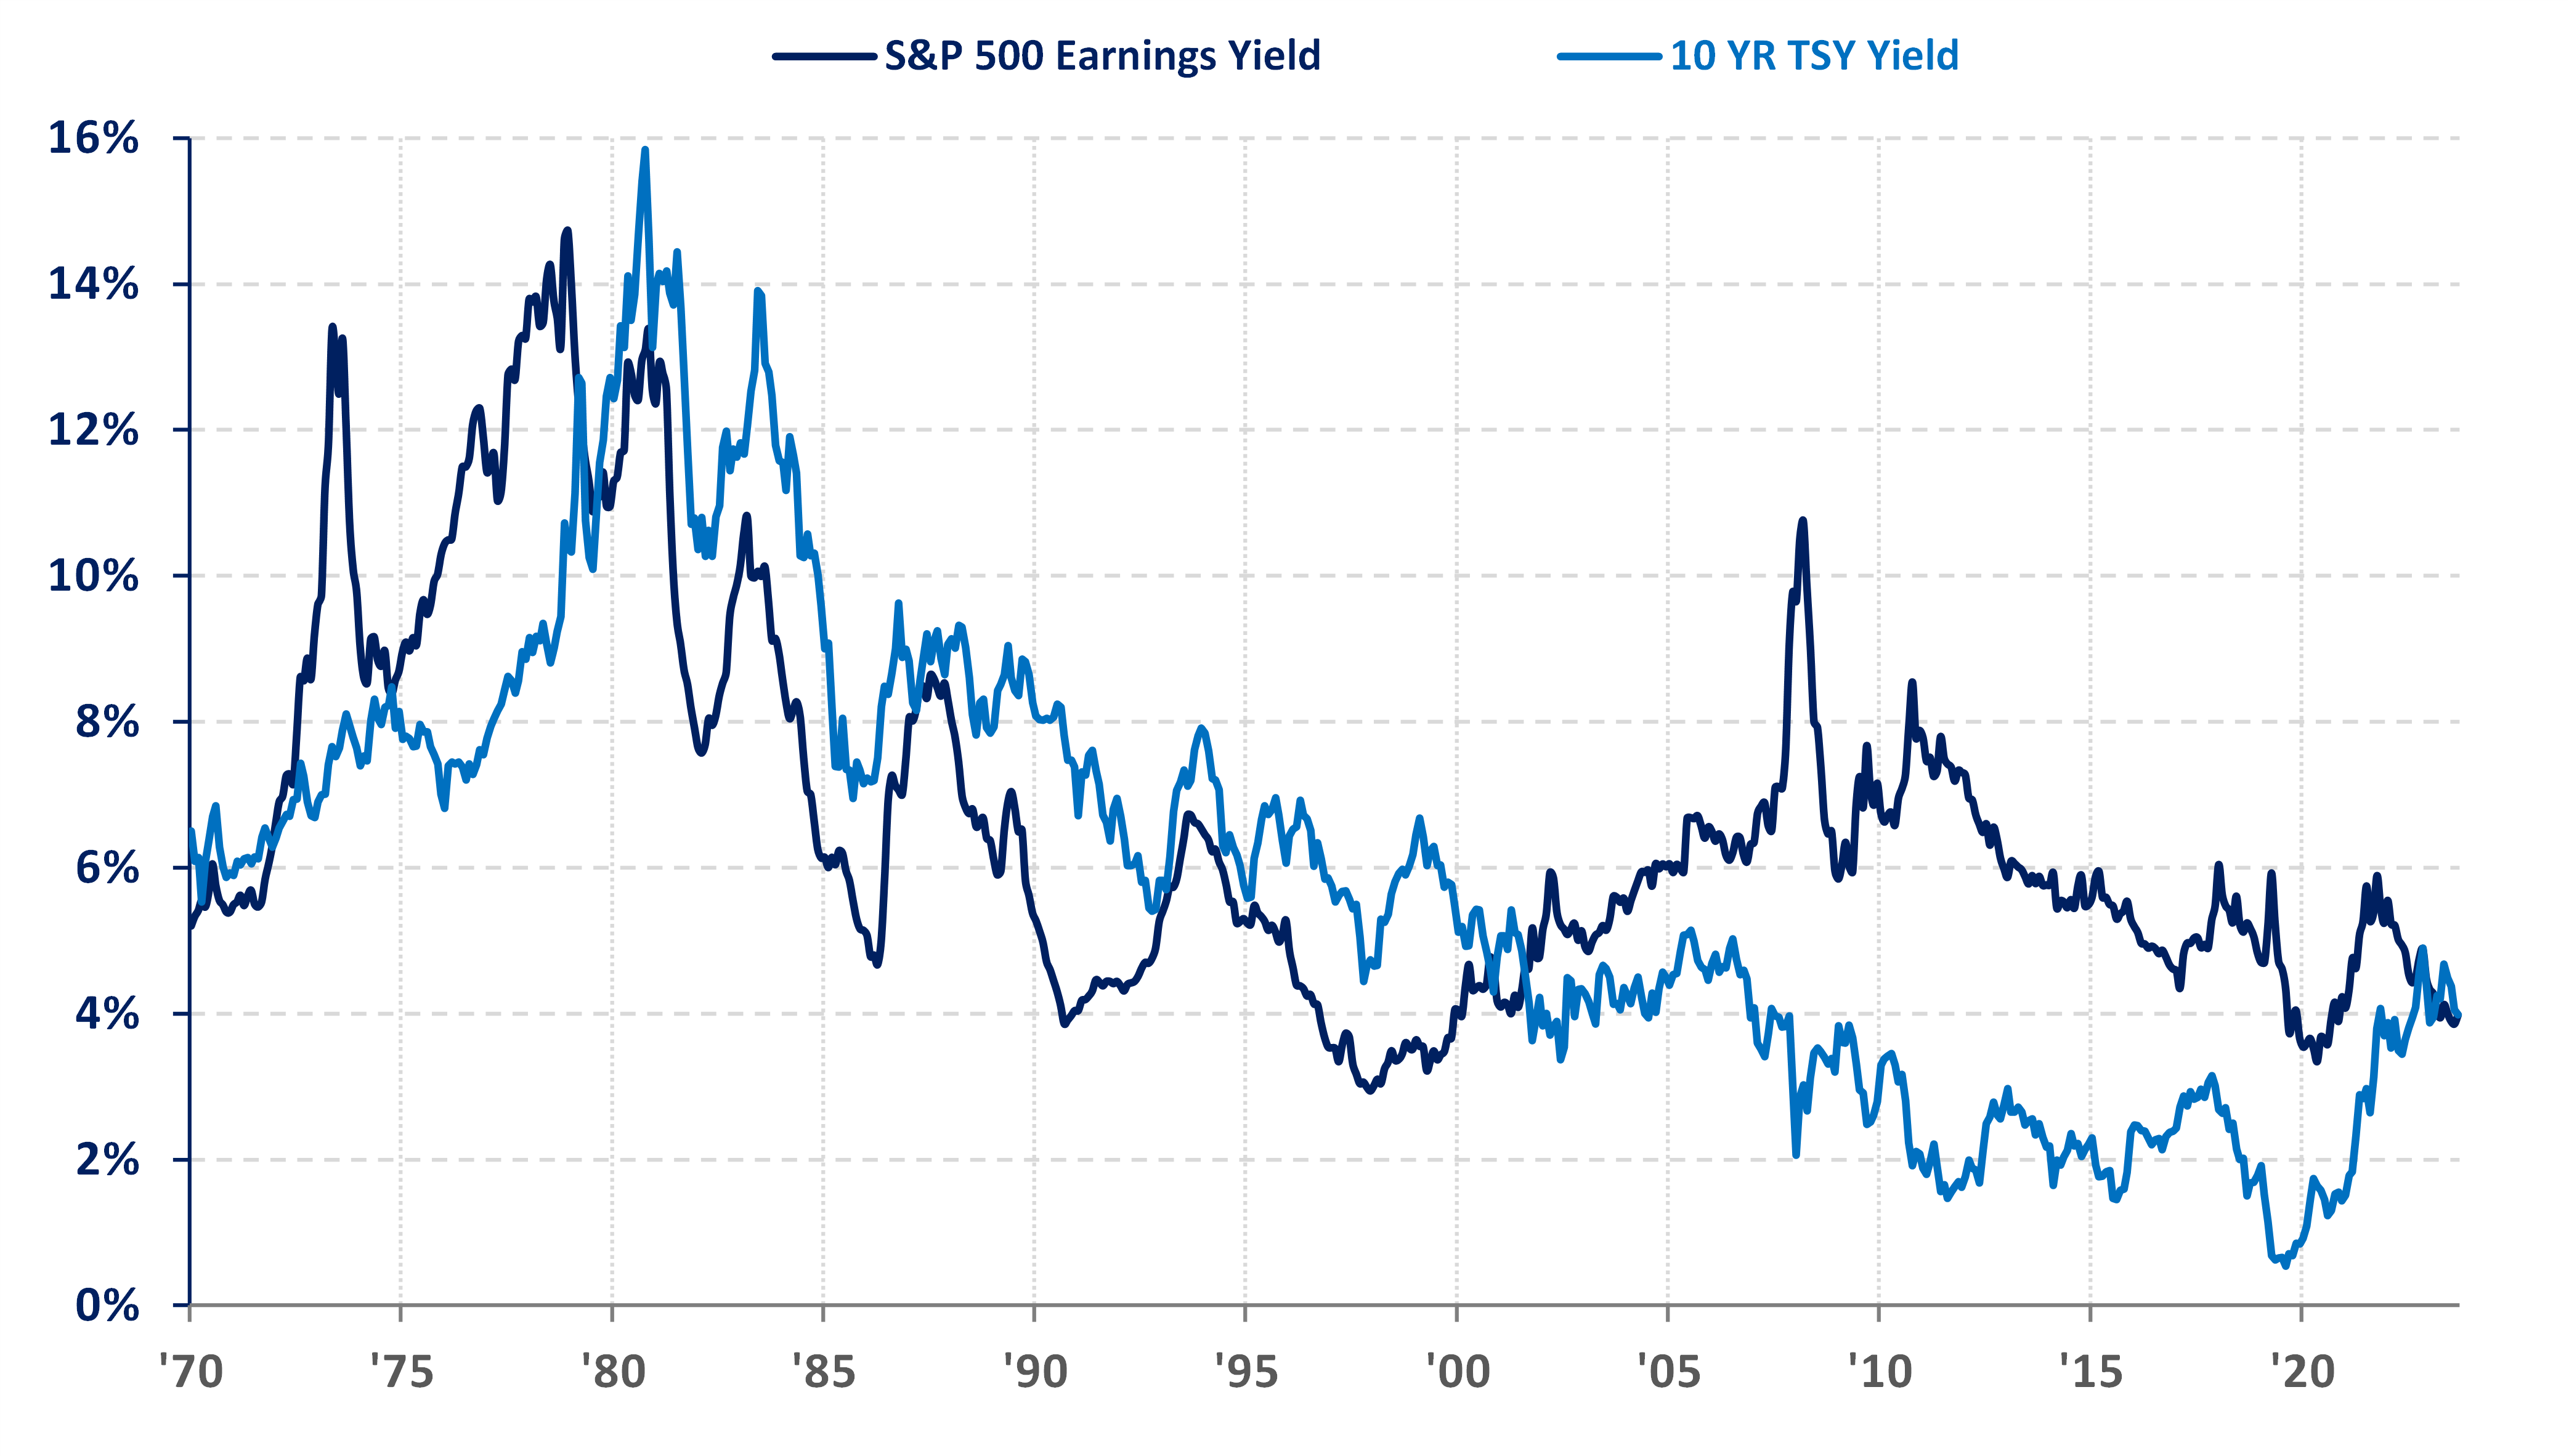
Our view of bonds is that they are caught between two opposing forces: a gradually weakening economy on one side and on the other a stubborn level of inflation that could reaccelerate due to the impact of tariffs. It seems increasingly likely that the Federal Reserve will cut short-term rates at least once this year. However, we don’t have a strong conviction about where long-term rates are likely to go. Getting 4%-ish interest on short-term Treasuries free of state and local income taxes with essentially no risk seems like an attractive opportunity in the current environment.
Chart 1: Long-term Historical Cyclically Adjusted PE Ratio with Recessions
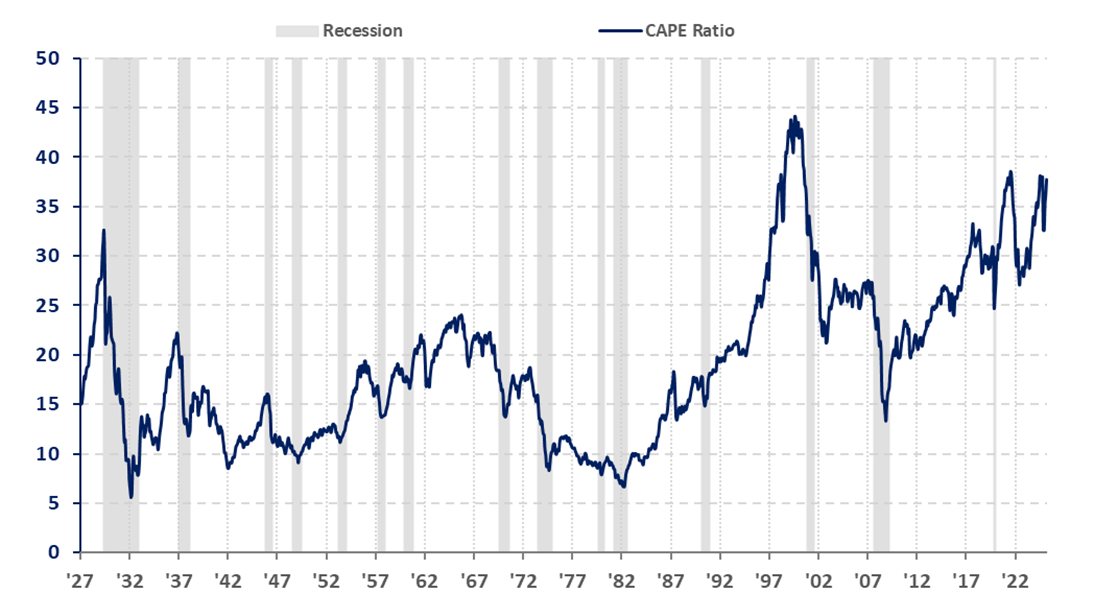
Chart 2: Wilshire 5000 Total Market Capitalization to US GDP
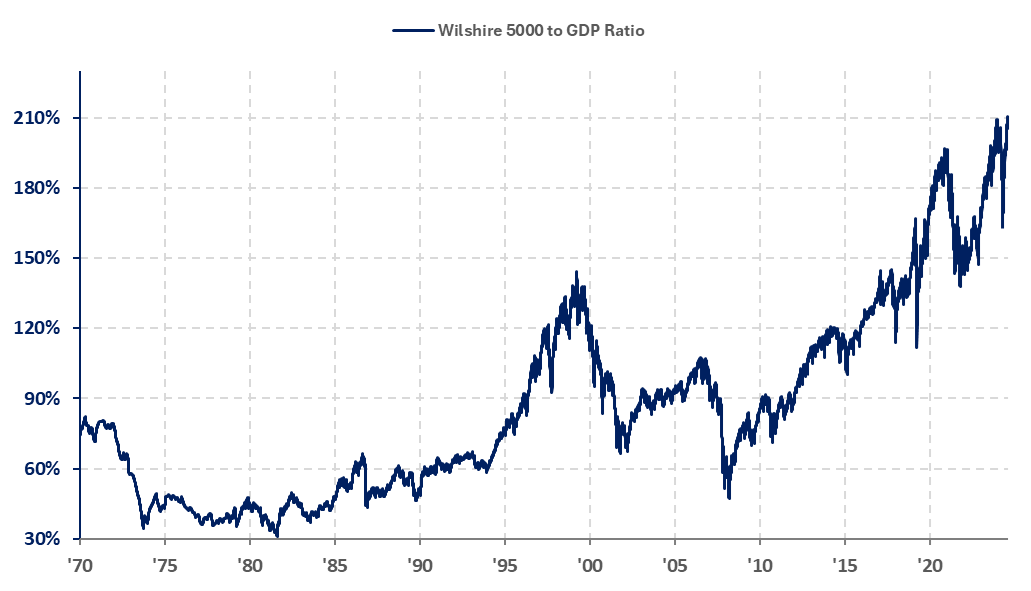
Chart 3: U.S. Large Cap versus Small Cap
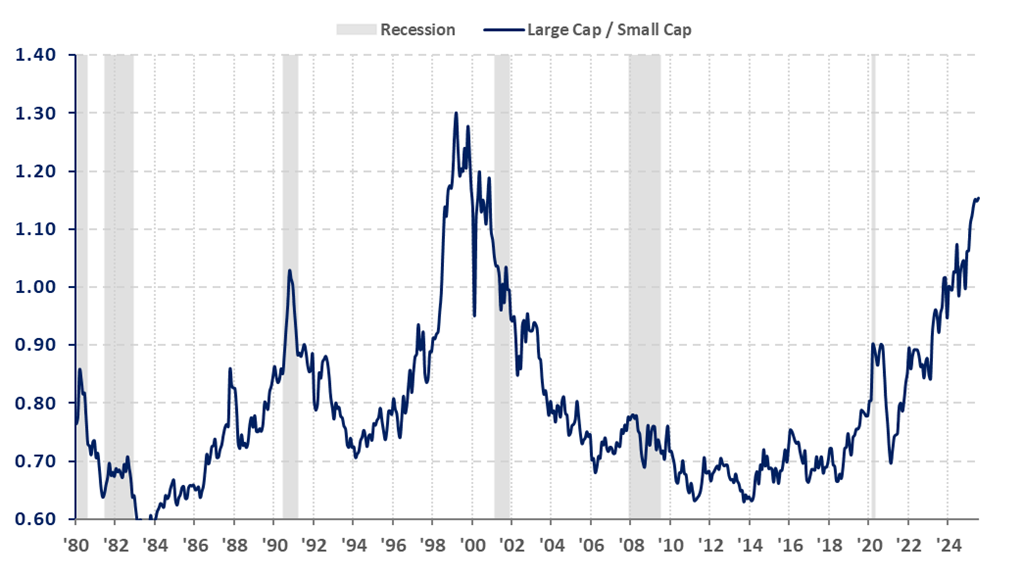
Chart 4: Russell 1000 Growth Index versus Russell 1000 Value Index
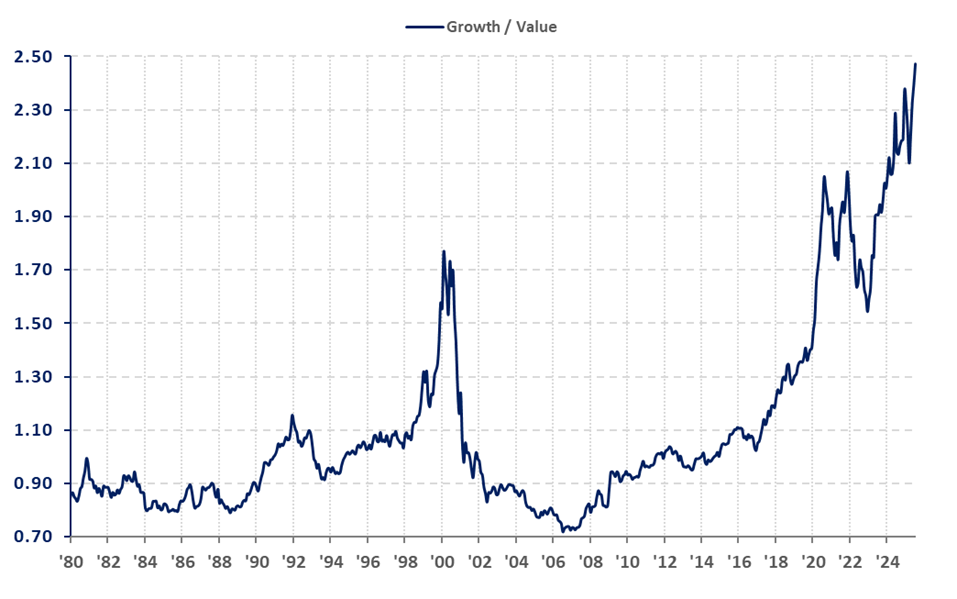
Chart 5: U.S. Stocks versus European Stocks
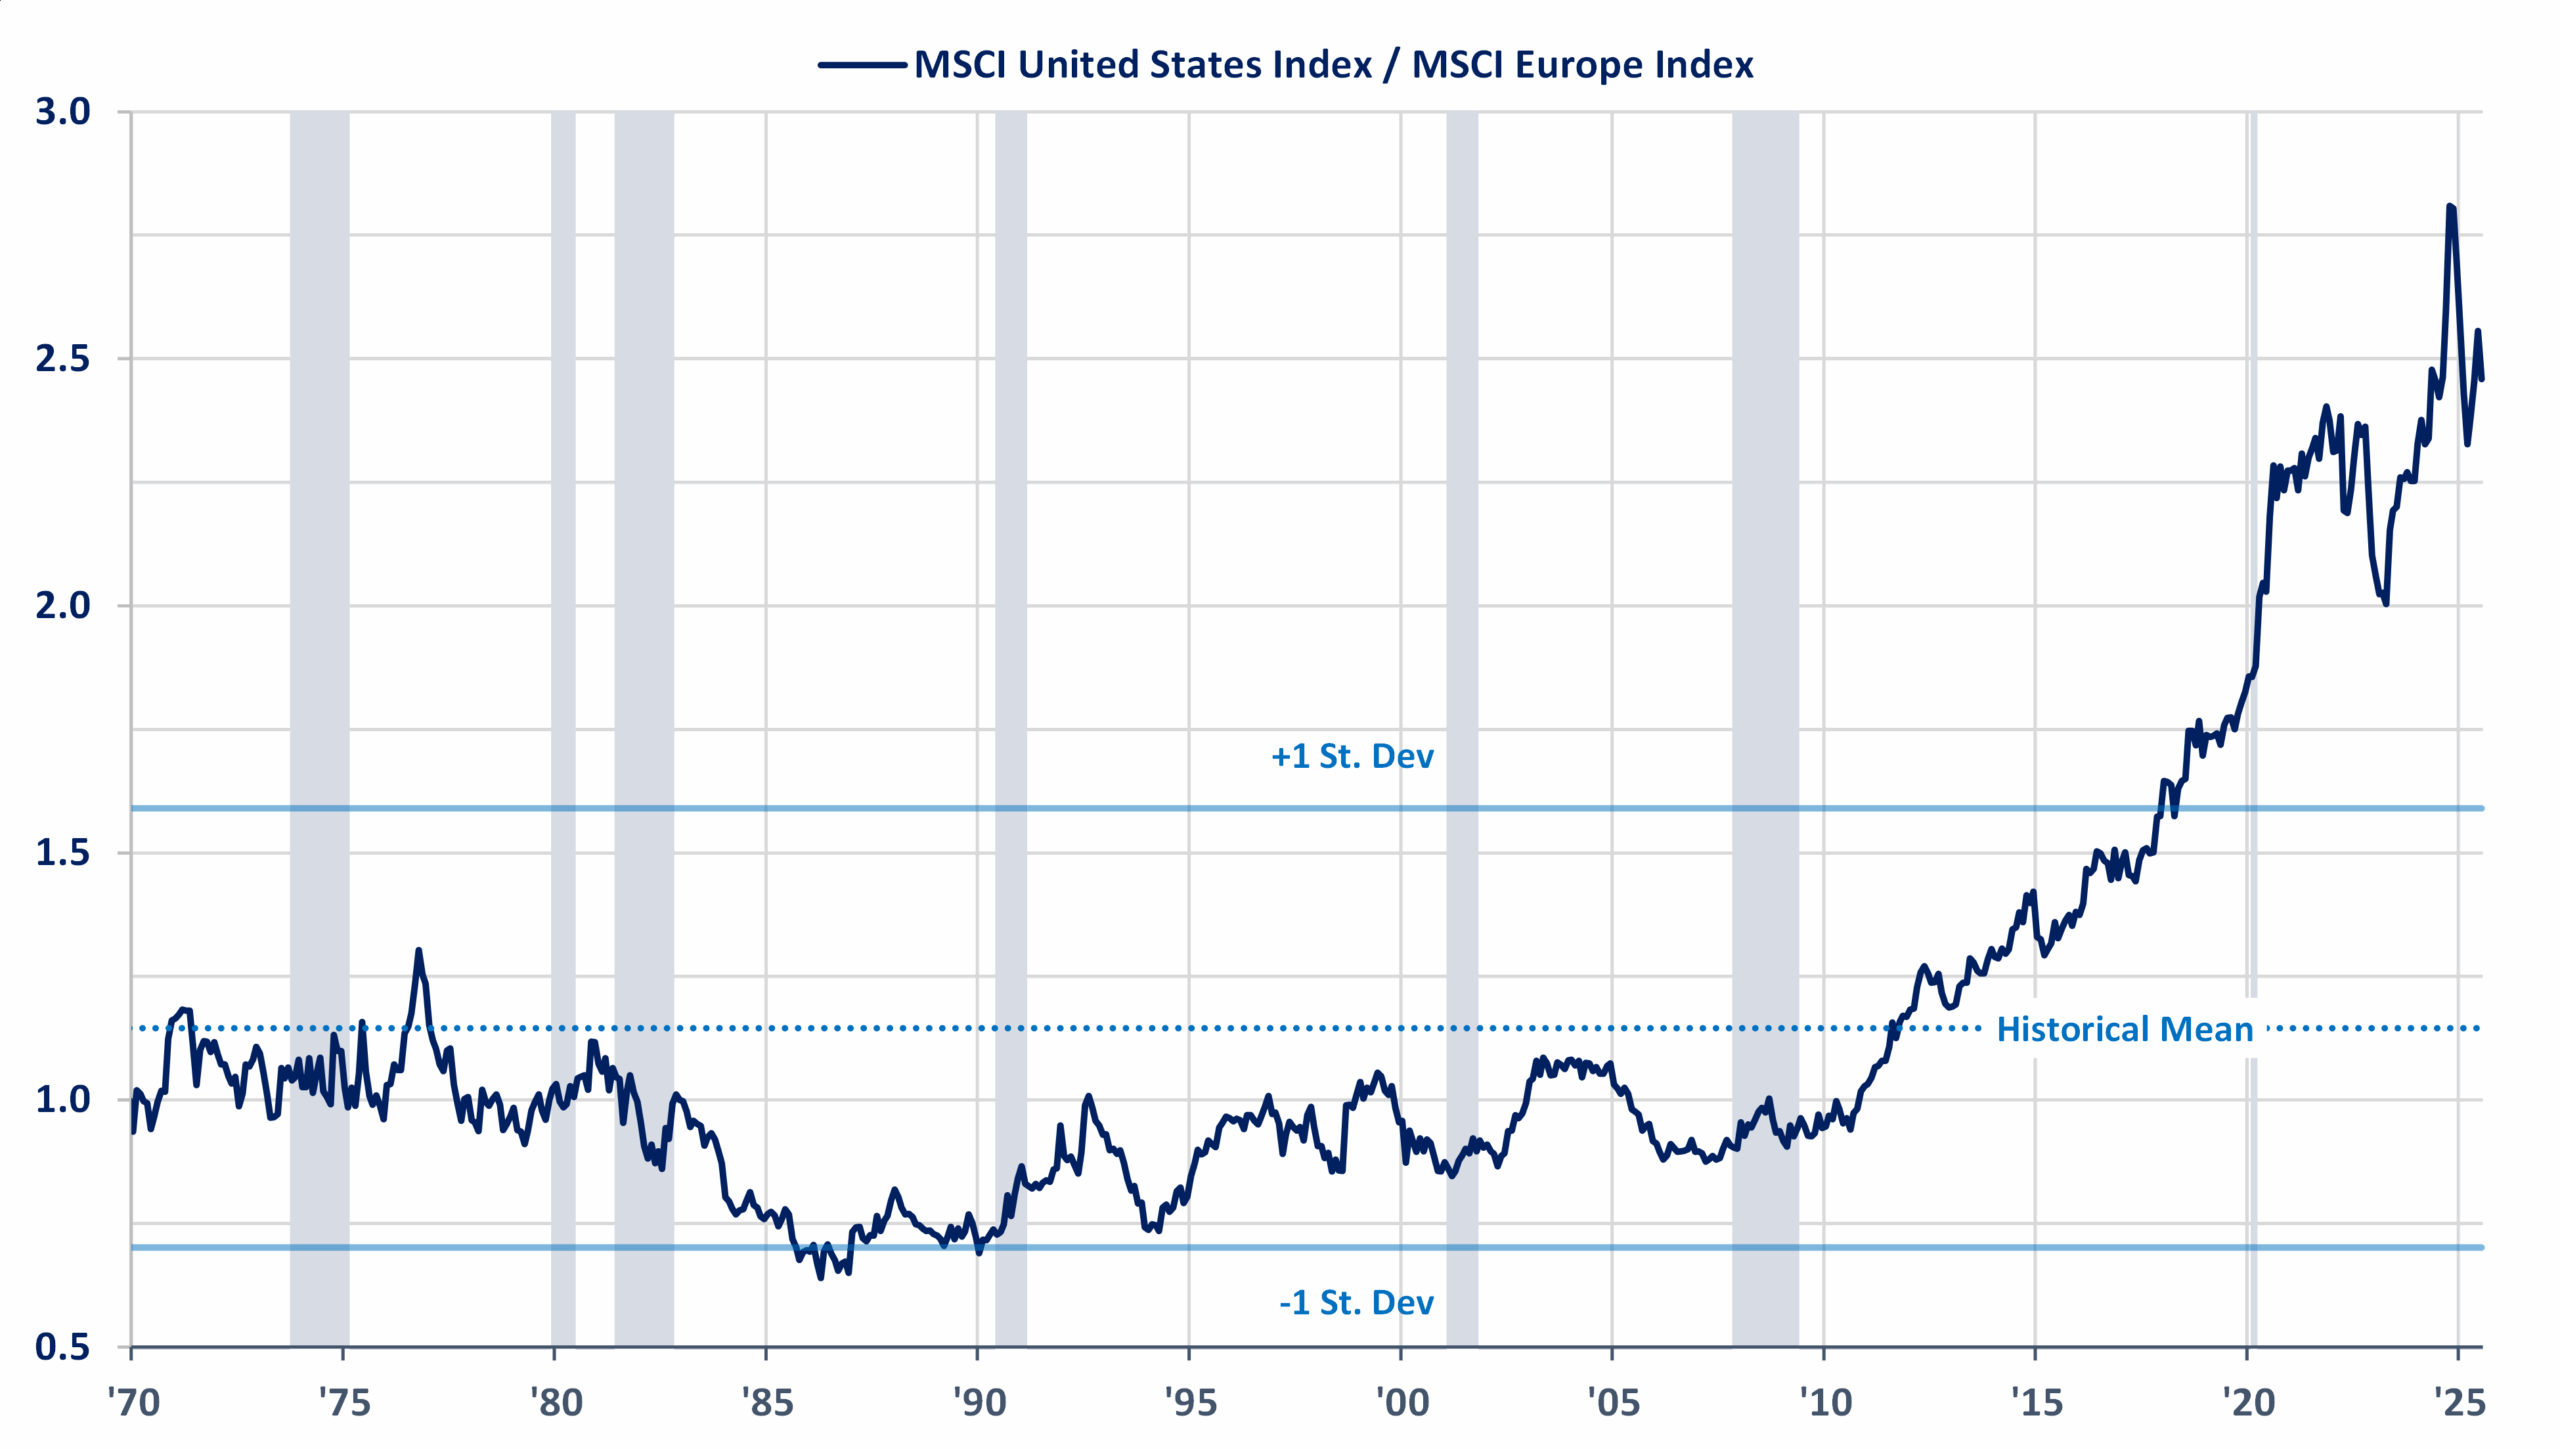
Chart 6: U.S. Dollar Index
Portfolio Management
We have made changes to most client equity portfolios so far this year. In April we reduced risk given the increased uncertainty in the corporate earnings outlook on the back of President Trump’s tariff announcement. As it became clearer that Trump was not going to actually follow through on most of his threats, we redeployed much of those proceeds into the Vanguard FTSE All World ex-U.S. ETF (Ticker: VEU) in order to further increase our exposure to non-U.S. stock markets.
In our fixed income portfolios, we slightly increased the duration of our holdings by swapping a 2027 Treasury note into the iShares Core U.S. Aggregate Bond ETF (AGG). This fund provides exposure to the entire U.S. investment-grade bond market and is comprised of about 70% Treasuries and agency bonds and notes with an average duration of about six years. The overall portfolio duration at BRAVE is still well below the benchmark as the majority of our holdings is in an October 2026 Treasury note, but we felt that it was prudent to make this change to reflect the increased uncertainty surrounding the U.S. economic outlook in the wake of the tariff policy changes.
Administrative Items
Please be sure to always inform us of any changes to mailing addresses, email addresses, or phone numbers. Also, if you have any issues with logging into NetXInvestor or Tamarac, please contact Suzie or Angie. They are happy to help and can usually get any issues resolved quickly.
We will be working on processing the remaining 2025 required minimum distributions from IRA accounts that are not on automatic distribution. If you are planning to make direct charitable contributions from your IRA account, please let us know ASAP to ensure they get processed well ahead of the end of the year to avoid a penalty. Our intention is to have all paperwork processed by November 14th.
Pershing has made a change in its policy on Federal tax payments. You can no longer have checks issued to the U.S. Treasury directly from your Pershing account. The money must now be transferred to your bank account and then you must write a check from that account. Please allow additional time for this additional step.
There will be a redesign and interface update of BRAVE’s client portal later this year. While the appearance will be refreshed, existing features will remain unchanged and you will continue to have access using the same link. You can securely upload and receive sensitive documents as well as view information such as account balances, holdings, monthly statements as well as yearend 1099s.
BRAVE Family Advisors will provide all prospective clients with a copy of our current Form ADV Part 2A (Disclosure Brochure), Privacy Policy and Form CRS prior to commencing an advisory relationship. You can view our current Form ADV Part 2A and Form CRS at adviserinfo.sec.gov. In addition, you can contact us to request a hard copy.
As always, we welcome your comments and questions. Never hesitate to call, visit, or email at any time.